吴恩达机器学习作业5——偏差/方差/训练集/验证集/测试集
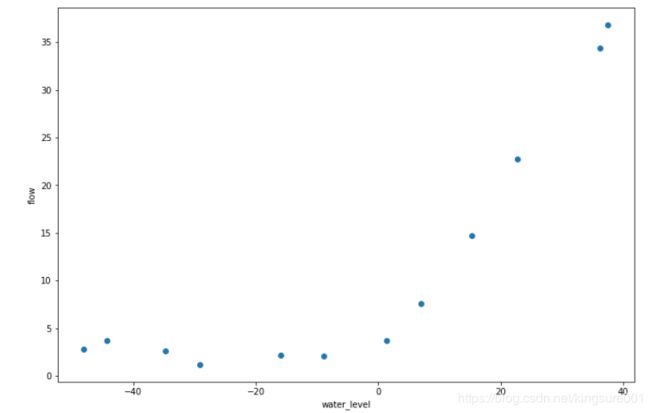
这一部分,我们需要先对一个水库的流出水量以及水库水位进行正则化线性归回。然后将会探讨方差-偏差的问题
1 数据可视化
import numpy as np
import scipy.io as sio
import scipy.optimize as opt
import pandas as pd
import matplotlib.pyplot as plt
import seaborn as sns
data = sio.loadmat('E:/shujuji/ex5data1.mat')
X,y,Xval,yval,Xtest,ytest= map(np.ravel,[data['X'], data['y'], data['Xval'], data['yval'], data['Xtest'], data['ytest']])
X.shape, y.shape, Xval.shape, yval.shape, Xtest.shape, ytest.shape
((12,), (12,), (21,), (21,), (21,), (21,))
fig,ax=plt.subplots(figsize=(12,8))
ax.scatter(X,y) #scatter散点图用
ax.set_xlabel('water_level')#横纵坐标名字
ax.set_ylabel('flow')
plt.show()
2 代价函数,及其正则化
#将X加一维
X, Xval, Xtest = [np.insert(x.reshape(x.shape[0], 1), 0, np.ones(x.shape[0]), axis=1) for x in (X, Xval, Xtest)]

def cost(theta, X, y):
    m = X.shape[0]
    inner = X @ theta - y  # R(m*1)
    square_sum = inner.T @ inner
    cost = square_sum / (2 * m)
    return cost

 def costReg(theta,X,y,reg):
    m=X.shape[0]
    cost=(1/(2*m))*np.sum(np.power((X@theta-y),2))
    regularized_term=(reg/(2*m))*np.power(theta[1:],2).sum()
    return cost+regularized_term
theta=np.ones(X.shape[1])
costReg(theta, X, y, 1)
303.9931922202643
3 正则化线性回归的梯度
def gradientReg(theta, X, y, reg):
    m=X.shape[0]
    inner=X.T@(X@theta-y)/m
    regularized_term=theta.copy()
    regularized_term[0]=0#将theta0置为0
    regularized_term= regularized_term*reg/m
    return inner+regularized_term
gradientReg(theta, X, y, 1)
array([-15.30301567, 598.25074417])
4 拟合线性回归
def linear_regression_np(X, y, l=1):
    theta = np.ones(X.shape[1])
    res=opt.minimize(fun=costReg, x0=theta, args=(X, y, l), method='TNC', jac=gradientReg, options={'disp': True})
    return res.x
final_theta=linear_regression_np(X, y, l=0)
final_theta
array([13.08790348, 0.36777923])
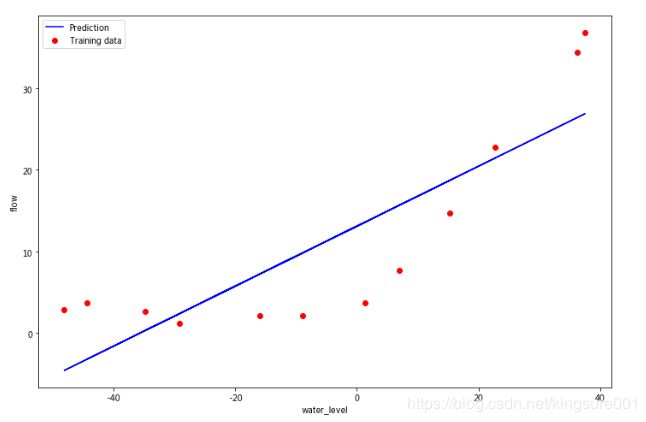
画出图看看
b=final_theta[0]#截距
m=final_theta[1]#斜率
fig,ax=plt.subplots(figsize=(12,8))
plt.scatter(X[:,1],y,label='Training data')
plt.plot(X[:,1],X[:,1]*m+b,label='Prediction')
ax.set_xlabel('water_level')
ax.set_ylabel('flow')
ax.legend()
plt.show()
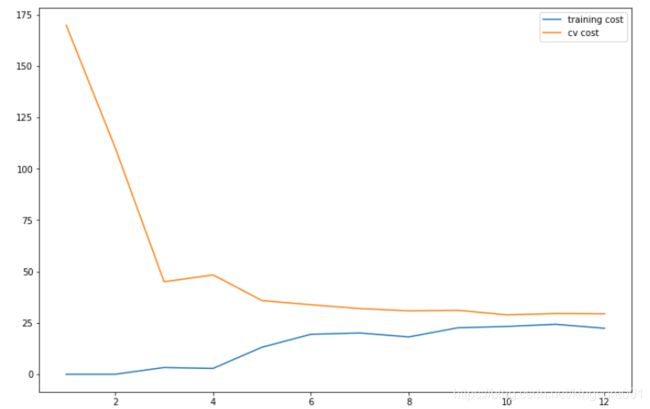
5 画学习曲线
训练样本,交叉验证
traning_cost,cv_cost=[],[]
m=X.shape[0]
for i in range(1,m+1):
    res= linear_regression_np(X[:i,:],y[:i],0)
    tc=costReg(res,X[:i,:],y[:i],0)
    cv=costReg(res,Xval,yval,0)
    traning_cost.append(tc)
    cv_cost.append(cv)
fig,ax=plt.subplots(figsize=(12,8))
plt.plot(np.arange(1,m+1),traning_cost,label="training cost")
plt.plot(np.arange(1, m+1), cv_cost, label='cv cost')
plt.legend()
plt.show()
6 多项式回归
线性回归对于现有数据来说太简单了,会欠拟合,我们需要多添加一些特征。 写一个函数,输入原始X,和幂的次数p,返回X的1到p次幂
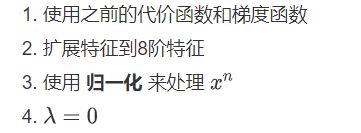
1 扩展特征到8阶特征,特征映射
def poly_features(x, power, as_ndarray=False): #扩展特征,特征映射
    data = {'f{}'.format(i): np.power(x, i) for i in range(1, power + 1)}
    #X的1到power次幂,放在字典
    df = pd.DataFrame(data)#变成表
    return df.values if as_ndarray else df
#重新获取数据
data = sio.loadmat('E:/shujuji/ex5data1.mat')
X,y,Xval,yval,Xtest,ytest= map(np.ravel,[data['X'], data['y'], data['Xval'], data['yval'], data['Xtest'], data['ytest']])
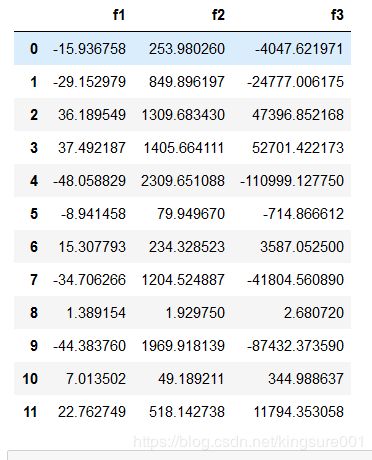
poly_features(X, power=3) #看看3次啥样
def normalize_feature(df):
    return df.apply(lambda column:(column-column.mean())/column.std())
#apply()方法,我们可以调用自己定义的函数,lambda函数也叫匿名函数,允许快速定义单行函数
#(每列值-每列均值)/每列方差
这里的lambda函数,请看一位大佬的链接: lambda函数.
3 总函数
def prepare_poly_data(*args, power):#args就相当于一个包(多个数据),这个包中有X, Xval, Xtest
    def prepare(x):
        df=poly_features(x, power=power)
        ndarr = normalize_feature(df).values
        return np.insert( ndarr,0,np.ones(ndarr.shape[0]),axis=1)
        #重新导数据了,加一维
    return [prepare(x) for x in args]
    #将X, Xval, Xtest分别代入prepare函数中
X_poly, Xval_poly, Xtest_poly= prepare_poly_data(X, Xval, Xtest, power=8)
X_poly[:3, :]
7 画出学习曲线
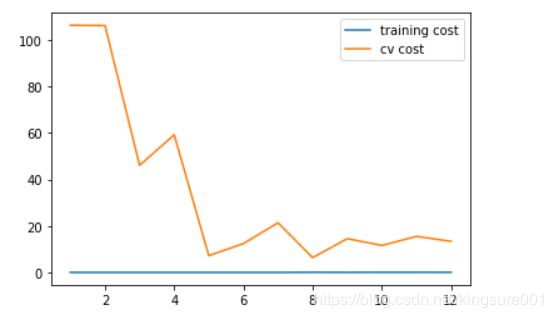
首先,我们没有使用正则化,所以 λ=0
def plot_learning_curve(X, y, Xval, yval, l=0):
    training_cost, cv_cost = [], []
    m = X.shape[0]
    for i in range(1,m+1):
        res= linear_regression_np(X[:i,:],y[:i],l)
        tc=costReg(res,X[:i,:],y[:i],l)
        cv=costReg(res,Xval,yval,l)

        training_cost.append(tc)
        cv_cost.append(cv)

    plt.plot(np.arange(1, m + 1), training_cost, label='training cost')
    plt.plot(np.arange(1, m + 1), cv_cost, label='cv cost')
    plt.legend(loc=1)
plot_learning_curve(X_poly, y, Xval_poly, yval, l=0)#l=0,没正则化
plt.show()
8 调整正则化系数λ
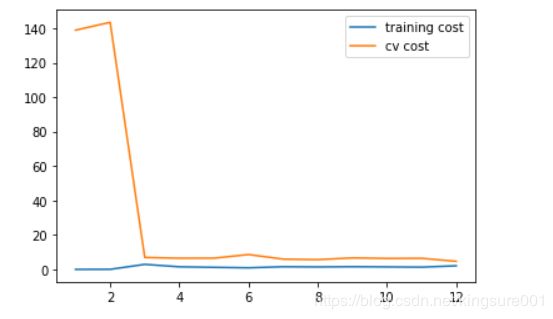
λ=1
plot_learning_curve(X_poly, y, Xval_poly, yval, l=1)#正则化
plt.show()
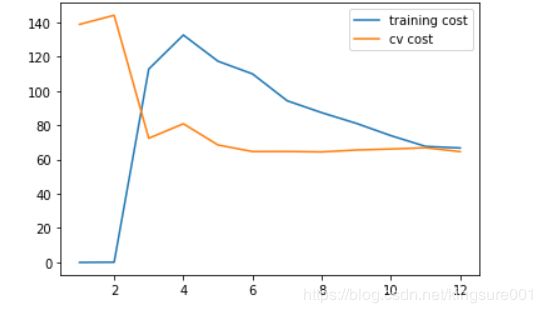
plot_learning_curve(X_poly, y, Xval_poly, yval, l=100)#正则化
plt.show()
找到合适λ
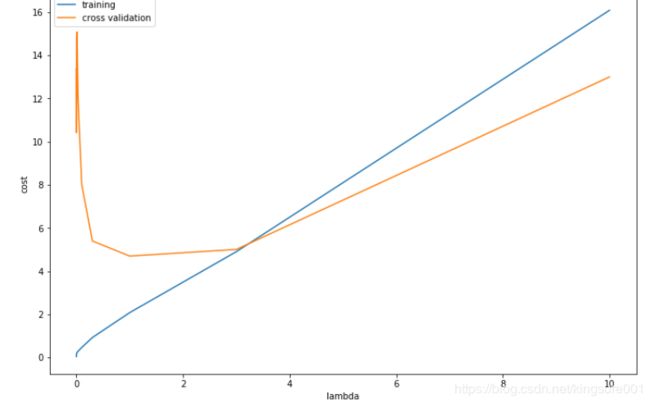
通过之前的实验,我们可以发现λ可以极大程度地影响正则化多项式回归。 所以这部分我们会会使用验证集去评价的表现好坏,然后选择表现最好的后,用测试集测试模型在没有出现过的数据上会表现多好。 尝试λ值[0, 0.001, 0.003, 0.01, 0.03, 0.1, 0.3, 1, 3, 10]
l_candidate=[0, 0.001, 0.003, 0.01, 0.03, 0.1, 0.3, 1, 3, 10]
training_cost, cv_cost = [], []
for l in l_candidate:#直接用全部样本
    res = linear_regression_np(X_poly, y, l)
    tc = cost(res, X_poly, y)
    cv = cost(res, Xval_poly, yval)
    training_cost.append(tc)
    cv_cost.append(cv)
fig, ax = plt.subplots(figsize=(12,8))
ax.plot(l_candidate, training_cost, label='training')
ax.plot(l_candidate, cv_cost, label='cross validation')
plt.legend()
plt.xlabel('lambda')
plt.ylabel('cost')
plt.show()
l_candidate[np.argmin(cv_cost)] #cv_cost最小值的索引,对应的lambda
结果为1
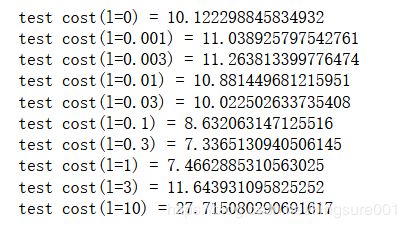
9 计算测试集上的误差
for l in l_candidate:
    theta = linear_regression_np(X_poly, y, l)
    print('test cost(l={}) = {}'.format(l, cost(theta, Xtest_poly, ytest)))
