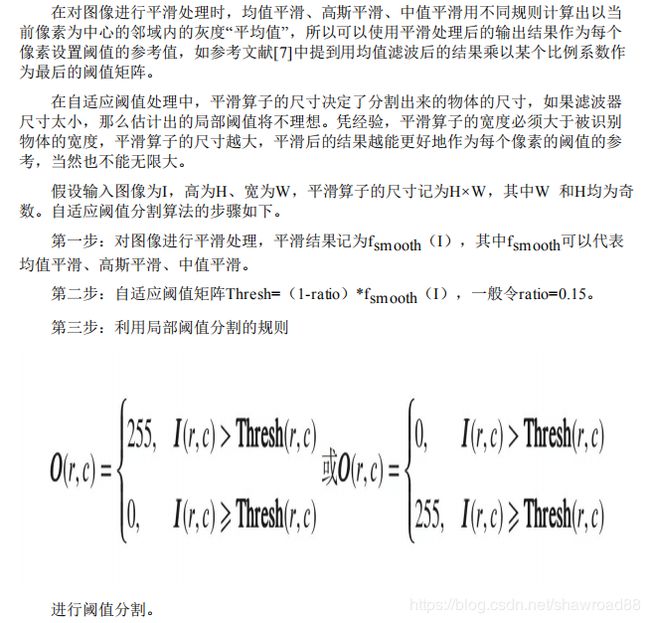
阈值分割小结
阈值分割
一: 全阈值分割
实例代码:
image = cv2.imread('img.jpg', cv2.IMREAD_GRAYSCALE)
the = 100   # 设置阈值为100
maxval = 255
dst, img = cv2.threshold(image, the, maxval, cv2.THRESH_BINARY)
cv2.imshow('hand_thresh', img)
cv2.waitKey(0)
cv2.destroyAllWindows()
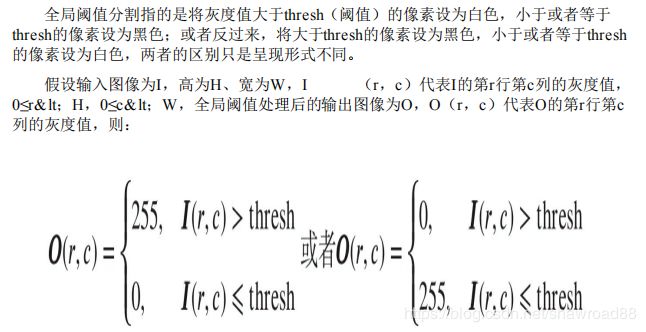
给出你的阈值 ,然后告诉你的最大阈值是多少 。。。也就是你二值图中一个阈值为0,另外一个阈值可以指定为多少。。这里指定为255
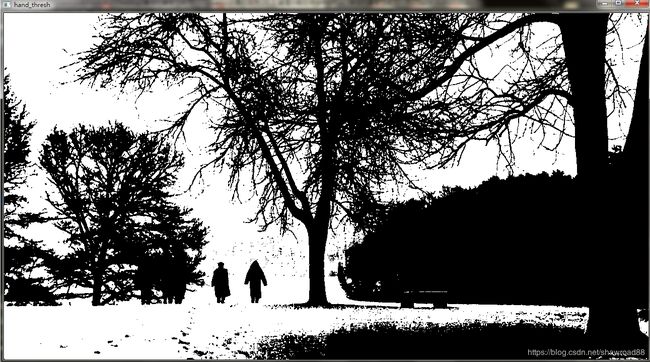
看一下输出结果。。
二:局部阈值分割
局部阈值分割的核心是计算阈值矩阵。。比较常用的是后面提到的自适应阈值算法。。我们等会后面讲实现。。
一个很好的例子:https://blog.csdn.net/qq_16540387/article/details/78892080
先给出一个MATLAB实现
由于光照的影响,图像的灰度可能是不均匀分布的,此时单一阈值的方法分割效果不好。Yanowitz提出了一种局部阈值分割方法。结合边缘和灰度信息找到阈值表面(treshhold surface)。在阈值表面上的就是目标。
![]()
算法的主要步骤如下:
- step1:均值平滑图像
- step2:求平滑图像的梯度图
- step3:运用Laplacian算子,找到具有局部最大阈值的点,这些点的原始灰度值就是候选的局部阈值。
![]()
- step4 :采样候选点,灰度值替换。将平滑图像中的候选点灰度值替换为原始图像中的灰度值或者更大一点的值。这么做的目的是不会检测到虚假目标,因而会损失一部分真实的目标。
- step5:插值灰度点,得到阈值表面。
l i m n → ∞ P n ( x , y ) = P n − 1 ( x , y ) + β ⋅ R n ( x , y ) 4 lim_{n \to \infty}P_n(x,y)=P_{n-1}(x,y)+\frac{\beta\cdot R_n(x,y)}{4} limn→∞Pn(x,y)=Pn−1(x,y)+4β⋅Rn(x,y)
R ( x , y ) = P ( x , y + 1 ) + P ( x , y − 1 ) + P ( x − 1 , y ) + P ( x + 1 , y ) − 4 P ( x , y ) R(x,y)=P(x,y+1)+P(x,y-1)+P(x-1,y)+P(x+1,y)-4P(x,y) R(x,y)=P(x,y+1)+P(x,y−1)+P(x−1,y)+P(x+1,y)−4P(x,y)
其中,只有当 β = 0 \beta=0 β=0时,残差消失(residual vanish)。 β < 2 \beta <2 β<2时收敛更快。 R ( x , y ) R(x,y) R(x,y)为拉普拉斯算子,强迫任意点 R ( x , y ) = 0 R(x,y)=0 R(x,y)=0的几何意义是使得曲线光滑。光滑曲线的梯度是连续变化的,因而其二次导数为0。
- step6:阈值表面分割图像
- step7:校正。由于光照和噪声,阈值表面和原始原始灰度曲线可能相交如下图所示。可以看到分割结果中出现 “ghost” 目标,应该予以去除。去除的原理是,这些虚假的目标边缘梯度值应该较小。因而,可以根据分割的结果,标记所有连通区域,注意背景和目标应该分开标记。比较标记部分边缘在梯度图中的值,如果某个目标的边缘梯度的平均值不超过某个阈值,则去除这个目标。

matlab 代码
function [P_new,label]=Local_Yanowitz(I,varargin);
% local adaptive  treshold segment by Yanowitz
% input:
%       I is Image M by N
% writed by radishgiant
%reference:S. D. Yanowitz and A. M. Bruckstein, "A new method for image
% segmentation," Comput. Graph. Image Process. 46, 82–95 ,1989.
dbstop if error
if nargin<=1||isempty(varargin{1});
    hsize=[3,3];
end
if nargin<=2||isempty(varargin{2});
    MaxInterNum=15500;
end
if nargin<=3||isempty(varargin{3});
    InterTreshhold=10e-6;
end
if nargin<=4||isempty(varargin{4});
    GradTresh=20;
end
% I=double(I);
[M,N]=size(I);
% step1:smooth the image
h1=fspecial('average',hsize);
SI=imfilter(I,h1);
%step2: calculate gradiant map
[Fx,Fy]=gradient(double(SI));
F=sqrt(Fx.^2+Fy.^2);
%step3 :Laplacian Image
h2=fspecial('laplacian',0);
LI=imfilter(SI,h2);
%step4:sample the smoothed image at the places which the maximal
%gradiant-mask points
P_new=zeros(M,N);
P_new(LI==0)=I(LI==0);

% step5: interpolate the sampled gray level over the image
Residual=InterTreshhold+1;
InterNum=0;
while (Residual>InterTreshhold)
    if(InterNum>MaxInterNum)
        fprintf('up to MaxInterNum without diveregence');
        break;
    end
    InterNum=InterNum+1;
    P_last=P_new;
    R=imfilter(P_new,h2);
    P_new=P_new+R./4;
    Residual=mean(abs(P_new(:)-P_last(:)));

end

% step:6 segment the Image
bw=zeros(M,N);
bw(I>P_new)=255;%background
figure,imshow(bw);title('first segment result')
% step:7 validation progress
label=bwlabel(bw,4);
RGBLabel=label2rgb(label);
figure,imshow(RGBLabel);title('connected component');
lable_n=length(unique(label));
gradientmean=zeros(lable_n,1);
toglabel=zeros(lable_n,1);
for ci=0:lable_n-1
    temp=zeros(size(I));
    temp(label==ci)=255;
    eg=edge(temp);
    gradientmean(ci+1)=mean(F(eg==1));
    [egr,egc]=find(eg==1);
    [~,mingI]=min(F(eg>=1));% find the location of gradient of min value in eg
    mingr=egr(mingI);%find the location of gradient of min value  over image
    mingc=egc(mingI);

        nearborlabel=[mingr+1,mingc;mingr-1,mingc;mingr,mingc+1;mingr,mingc-1];
    nearborlogical=ones(4,1);
        if (mingr==1)
        nearborlogical(2)=0;
        end
        if (mingr==M)
        nearborlogical(1)=0;
        end
    if (mingc==1)
         nearborlogical(4)=0;
    end
    if mingc==N
       nearborlogical(3)=0;
    end
    nearborlabel=nearborlabel(nearborlogical==1,:);
    nearborlabel=label(sub2ind([M,N],nearborlabel(:,1),nearborlabel(:,2)));
    dlilabel=label(mingr,mingc);
    if nnz(nearborlabel~=dlilabel)
        toglabel(ci+1)=mode(nearborlabel(nearborlabel~=dlilabel));
    else
        toglabel(ci+1)=dlilabel;
    end
end
dli=find(gradientmean% find background label
bl=mode(label(bw==255));
for di=1:length(dli)

    label(label==dli(di))=toglabel(dli(di));
end
RGBLabel=label2rgb(label);
figure,imshow(RGBLabel);title('segment result after valiation');
figure,plot(1:N,I(mingr,:),1:N,P_new(mingr,:));
legend('gray level','Treshold surface');
end
参考文献
[1]S. D. Yanowitz and A. M. Bruckstein, “A new method for image
segmentation,” Comput. Graph. Image Process. 46, 82–95 ,1989.
三:直方图技术法
代码实现:
import numpy as np
import cv2


def calcGrayHist(image):
    '''
    统计像素值
    :param image:
    :return:
    '''
    # 灰度图像的高,宽
    rows, cols = image.shape
    # 存储灰度直方图
    grayHist = np.zeros([256], np.uint64)
    for r in range(rows):
        for c in range(cols):
            grayHist[image[r][c]] += 1
    return grayHist

def threshTwoPeaks(image):
    # 计算灰度直方图
    histogram = calcGrayHist(image)

    # 找到灰度直方图的最大峰值对应的灰度值
    maxLoc = np.where(histogram == np.max(histogram))
    firstPeak = maxLoc[0][0]

    # 寻找灰度直方图的第二个峰值对应的灰度值
    measureDists = np.zeros([256], np.float32)
    for k in range(256):
        measureDists[k] = pow(k - firstPeak, 2)*histogram[k]
    maxLoc2 = np.where(measureDists == np.max(measureDists))
    secondPeak = maxLoc2[0][0]

    # 找两个峰值之间的最小值对应的灰度值,作为阈值
    thresh = 0
    if firstPeak > secondPeak:
        temp = histogram[int(secondPeak): int(firstPeak)]
        minLoc = np.where(temp == np.min(temp))
        thresh = secondPeak + minLoc[0][0] + 1
    else:
        temp = histogram[int(firstPeak): int(secondPeak)]
        minLoc = np.where(temp == np.min(temp))
        thresh = firstPeak + minLoc[0][0] + 1

    # 找到阈值,我们进行处理
    img = image.copy()
    img[img > thresh] = 255
    img[img <= thresh] = 0
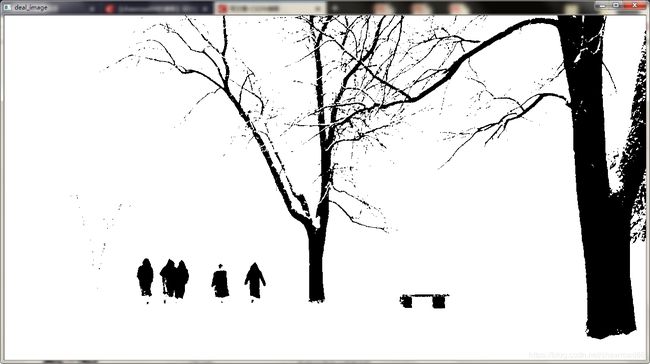
    cv2.imshow('deal_image', img)
    cv2.waitKey(0)
    cv2.destroyAllWindows()

if __name__ == '__main__':

    image = cv2.imread('img.jpg', cv2.IMREAD_GRAYSCALE)
    threshTwoPeaks(image)
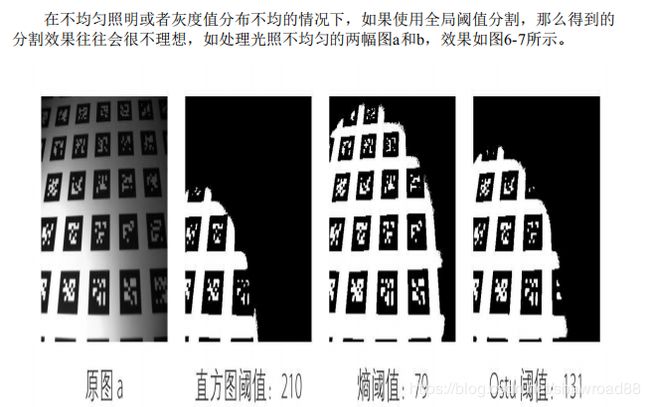
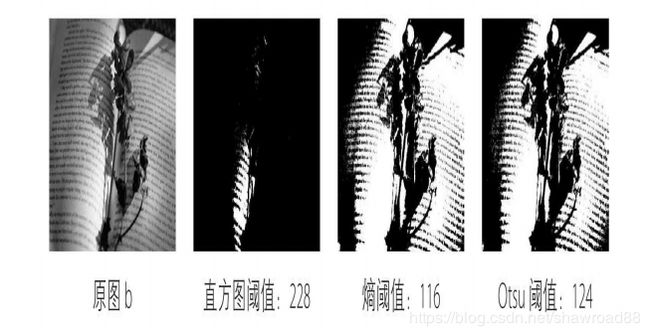
输出结果:
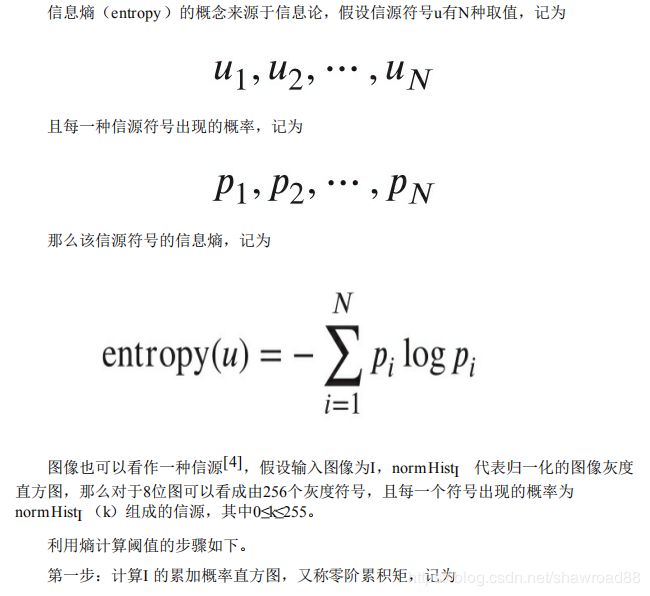
四:熵算法
代码实现:
import numpy as np
import cv2
import math

def calcGrayHist(image):
    '''
    统计像素值
    :param image:
    :return:
    '''
    # 灰度图像的高,宽
    rows, cols = image.shape
    # 存储灰度直方图
    grayHist = np.zeros([256], np.uint64)
    for r in range(rows):
        for c in range(cols):
            grayHist[image[r][c]] += 1
    return grayHist


def threshEntroy(image):

    rows, cols = image.shape
    # 求灰度直方图
    grayHist = calcGrayHist(image)
    # 归一化灰度直方图,即概率直方图
    normGrayHist = grayHist / float(rows*cols)

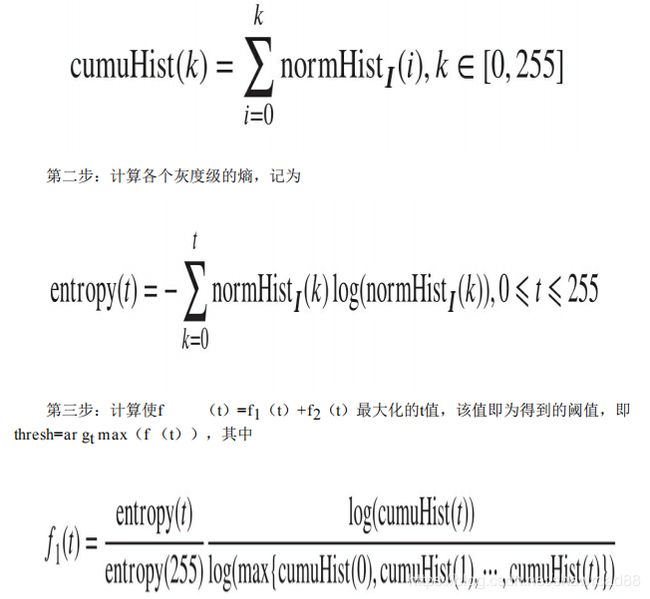
    # 第一步:计算累加直方图,也称零阶累积矩
    zeroCumuMoment = np.zeros([256], np.float32)
    for k in range(256):
        if k == 0:
            zeroCumuMoment[k] = normGrayHist[k]
        else:
            zeroCumuMoment[k] = zeroCumuMoment[k-1] + normGrayHist[k]

    # 第二步:计算各个灰度级的熵
    entropy = np.zeros([256], np.float32)
    for k in range(256):
        if k == 0:
            if normGrayHist[k] == 0:
                entropy[k] = 0
            else:
                entropy[k] = -normGrayHist[k]*math.log10(normGrayHist[k])
        else:
            if normGrayHist[k] == 0:
                entropy[k] = entropy[k-1]
            else:
                entropy[k] = entropy[k-1] - normGrayHist[k]*math.log10(normGrayHist[k])
    # 第三步:找阈值
    fT = np.zeros([256], np.float32)
    ft1, ft2 = 0.0, 0.0
    totalEntropy = entropy[255]
    for k in range(255):
        # 找最大值
        maxFront = np.max(normGrayHist[0: k+1])
        maxBack = np.max(normGrayHist[k+1: 256])
        if (maxFront == 0 or zeroCumuMoment[k] == 0
                or maxFront == 1 or zeroCumuMoment[k] == 1 or totalEntropy == 0):
            ft1 = 0
        else:
            ft1 = entropy[k] / totalEntropy*(math.log10(zeroCumuMoment[k])/math.log10(maxFront))


        if (maxBack == 0 or 1-zeroCumuMoment[k] == 0
                or maxBack == 1 or 1-zeroCumuMoment[k] == 1):
            ft2 = 0
        else:
            if totalEntropy == 0:
                ft2 = (math.log10(1-zeroCumuMoment[k]) / math.log10(maxBack))
            else:
                ft2 = (1-entropy[k]/totalEntropy)*(math.log10(1-zeroCumuMoment[k])/math.log10(maxBack))
        fT[k] = ft1 + ft2

    # 找最大值的索引,作为得到的阈值
    threshLoc = np.where(fT == np.max(fT))
    thresh = threshLoc[0][0]

    # 阈值处理
    threshold = np.copy(image)
    threshold[threshold > thresh] = 255
    threshold[threshold <= thresh] = 0
    return threshold

if __name__ == '__main__':
    image = cv2.imread('img5.jpg', cv2.IMREAD_GRAYSCALE)
    img = threshEntroy(image)
    cv2.imshow('origin', image)
    cv2.imshow('deal_image', img)
    cv2.waitKey(0)
    cv2.destroyAllWindows()
输出结果:
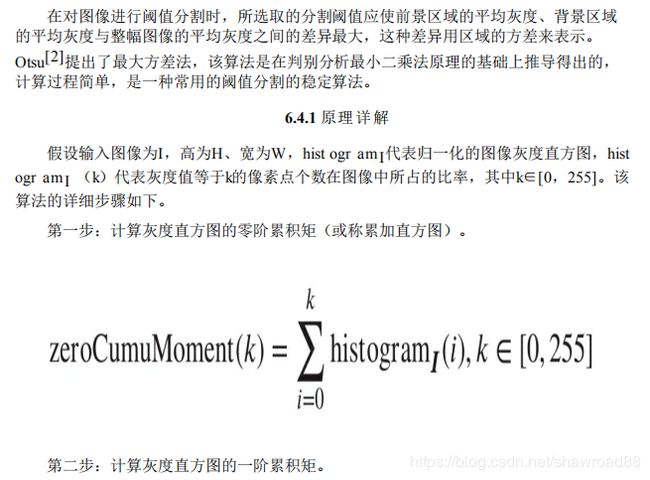
五:Otsu算法
这里就不具体实现了。。我们调用opencv给的API
image = cv2.imread('img.jpg', cv2.IMREAD_GRAYSCALE)
maxval = 255
otsuThe = 0
otsuThe, dst_Otsu = cv2.threshold(image, otsuThe, maxval, cv2.THRESH_OTSU)
cv2.imshow('Otsu', dst_Otsu)
cv2.waitKey(0)
cv2.destroyAllWindows()
输出结果:
六:自适应阈值算法
代码实现:
import cv2
import numpy as np

def adaptiveThresh(I, winSize, ratio=0.15):

    # 第一步:对图像矩阵进行均值平滑
    I_mean = cv2.boxFilter(I, cv2.CV_32FC1, winSize)

    # 第二步:原图像矩阵与平滑结果做差
    out = I - (1.0 - ratio) * I_mean

    # 第三步:当差值大于或等于0时,输出值为255;反之,输出值为0
    out[out >= 0] = 255
    out[out < 0] = 0
    out = out.astype(np.uint8)
    return out

if __name__ == '__main__':

    image = cv2.imread('img7.jpg', cv2.IMREAD_GRAYSCALE)
    img = adaptiveThresh(image, (5, 5))
    cv2.imshow('origin', image)
    cv2.imshow('deal_image', img)
    cv2.waitKey(0)
    cv2.destroyAllWindows()
OSTU
一、OTSU法(大津阈值分割法)介绍
OTSU算法是由日本学者OTSU于1979年提出的一种对图像进行二值化的高效算法,是一种自适应的阈值确定的方法,又称大津阈值分割法,是最小二乘法意义下的最优分割。
二、单阈值OTSU法
设图像包含L个灰度级,灰度值为i的像素点个数为Ni,像素总点数为:
N = N 0 + N 1 + ⋯ + N L − 1 N = N_0 + N_1 + \cdots + N_{L-1} N=N0+N1+⋯+NL−1
则灰度值为i的点的概率为:
P i = N i N P_i = \frac{N_i}{N} Pi=NNi
根据期望公式,图像灰度的均值为:
μ T = ∑ i = 0 L − 1 i P i \mu_T = \sum_{i=0}^{L-1}iPi μT=i=0∑L−1iPi
按图像的灰度特性,使用阈值T将图像分成目标c0和背景c1两类,则ω0(T)和ω1(T)分别表示阈值为T时,c0和c1发生的概率,即:
ω 0 ( T ) = ∑ i = 0 T P i ω 1 ( T ) = 1 − ω 0 ( T ) {\omega}_0(T) = \sum_{i=0}^T P_i \\ {\omega}_1(T) = 1-{\omega}_0(T) ω0(T)=i=0∑TPiω1(T)=1−ω0(T)
c 0 c0 c0和 c 1 c1 c1的均值为:
μ 0 ( T ) = ∑ i = 0 T i P i ω 0 ( T ) μ 1 ( T ) = μ T − ∑ i = 0 T i P i ω 1 ( T ) \mu_0(T) = \frac{\sum_{i=0}^T iPi}{\omega_0(T)} \\ \mu_1(T) = \frac{\mu_T - \sum_{i=0}^T iPi}{\omega_1(T)} μ0(T)=ω0(T)∑i=0TiPiμ1(T)=ω1(T)μT−∑i=0TiPi
σ 2 ( T ) σ^2(T) σ2(T)表示直方图中阈值为T的类间方差,定义为:
σ B 2 ( T ) = ω 0 ( T ) [ μ 0 ( T ) − μ T ] 2 + ω 1 ( T ) [ μ 1 ( T ) − μ T ] 2 \sigma^2_B(T) = \omega_0(T)[\mu_0(T) - \mu_T]^2 + \omega_1(T)[\mu_1(T) - \mu_T]^2 σB2(T)=ω0(T)[μ0(T)−μT]2+ω1(T)[μ1(T)−μT]2
最优阈值定义为类间方差最大时对应的T值,即:
σ B 2 ( T ∗ ) = max 0 ≤ T ≤ L − 1 { σ B 2 ( T ) } \sigma^2_B(T^*) = \max_{0\leq T \leq L-1} \{ \sigma^2_B(T) \} σB2(T∗)=0≤T≤L−1max{σB2(T)}
下面给出python源代码。
#coding:utf-8
import cv2
import numpy as np
from matplotlib import pyplot as plt

image = cv2.imread("E:/python/cv/OTSU/test.jpg")
gray = cv2.cvtColor(image, cv2.COLOR_BGR2GRAY)

plt.subplot(131), plt.imshow(image, "gray")
plt.title("source image"), plt.xticks([]), plt.yticks([])
plt.subplot(132), plt.hist(image.ravel(), 256)
plt.title("Histogram"), plt.xticks([]), plt.yticks([])
ret1, th1 = cv2.threshold(gray, 0, 255, cv2.THRESH_OTSU)  #方法选择为THRESH_OTSU
plt.subplot(133), plt.imshow(th1, "gray")
plt.title("OTSU,threshold is " + str(ret1)), plt.xticks([]), plt.yticks([])
plt.show()
结果如下所示。可以看到,使用OTSU法计算出来的阈值为165。
![]()
三、多阈值OTSU法
将单阈值的OTSU推广到多阈值的图像分割中,假设将图像直方图分为m+1类,对应的阈值为T1,T2,···,Tm。则最大类间方差为:
σ B 2 ( T 1 ∗ , T 2 ∗ , ⋯ , T m ∗ ) = max 0 ≤ T 1 ≤ T 2 ≤ ⋯ ≤ L − 1 { σ B 2 ( T 1 , T 2 , ⋯ , T m ) } \sigma^2_B(T^*_1,T^*_2,\cdots,T^*_m) = \max_{0\leq T_1 \leq T_2 \leq \cdots \leq L-1} \{ \sigma^2_B(T_1,T_2,\cdots,T_m) \} σB2(T1∗,T2∗,⋯,Tm∗)=0≤T1≤T2≤⋯≤L−1max{σB2(T1,T2,⋯,Tm)}
其中,
σ B 2 ( T 1 , T 2 , ⋯ , T m ) = ∑ i = 0 m ω i ( T 1 , T 2 , ⋯ , T m ) [ μ i ( T 1 , T 2 , ⋯ , T m ) − μ T ] 2 μ i ( T 1 , T 2 , ⋯ , T m ) = ∑ i = T i T i + 1 i P i ω i ( T 1 , T 2 , ⋯ , T m ) ω i ( T 1 , T 2 , ⋯ , T m ) = ∑ i = T i T i + 1 P i μ T = ∑ i = 0 L − 1 i P i \sigma^2_B(T_1,T_2,\cdots,T_m) = \sum_{i=0}^m \omega_i(T_1,T_2,\cdots,T_m)[\mu_i(T_1,T_2,\cdots,T_m) - \mu_T]^2 \\ \mu_i(T_1,T_2,\cdots,T_m) = \sum_{i = T_i}^{T_{i+1}} \frac{iP_i}{\omega_i(T_1,T_2,\cdots,T_m)} \\ \omega_i(T_1,T_2,\cdots,T_m) = \sum_{i=T_i}^{T_{i+1}} P_i \\ \mu_T = \sum_{i=0}^{L-1} iP_i σB2(T1,T2,⋯,Tm)=i=0∑mωi(T1,T2,⋯,Tm)[μi(T1,T2,⋯,Tm)−μT]2μi(T1,T2,⋯,Tm)=i=Ti∑Ti+1ωi(T1,T2,⋯,Tm)iPiωi(T1,T2,⋯,Tm)=i=Ti∑Ti+1PiμT=i=0∑L−1iPi
为求得最优阈值,需要使用穷举搜索,随着m增大,计算量骤增。若使用牛顿迭代等优化搜索方法,容易陷入局部最优解。
四、遗传算法解OTSU
遗传算法是一种基于自然选择和群体遗传机理的搜索算法。它模拟了自然选择和自然遗传过程中发生的繁殖、交配和突变现象,将每一个可能的解看作是群体的一个个体,并将每个个体编码,根据设定的目标函数对每个个体进行评价,给出一个适应度值。开始时随机产生一些个体,利用遗传算子产生新一代的个体,新个体继承上一代的优良性状,逐步向更优解进化。由于遗传算法在每一代同时搜索参数空间的不同区域,从而能够使找到全局最优解的可能性大大增加。遗传算法属于启发式算法,无限趋紧最优解并收敛。
那么怎么将图像分割问题抽象成遗传问题,即怎么将问题编码成基因串,如何构造适应度函数来度量每条基因的适应度值。假设如上述三所示,将图像分为m+1类,则m个阈值按顺序排列起来构成一个基因串:
α = { T 1 , T 2 , ⋯ , T m } \alpha = \{ T_1,T_2,\cdots,T_m \} α={T1,T2,⋯,Tm}
由于灰度为0~255,所以可以使用8位二进制代码表示每个阈值,此时每个基因串由长度为8*m个比特位的传组成。
将类间方差作为其适应度函数,类间方差越大,适应度函数值就越高。
python代码如下所示:
#coding:utf-8
import cv2
import numpy as np
from matplotlib import pyplot as plt
import random


#将不足8*m位的染色体扩展为8*m位
def expand(k, m):
    for i in range(len(k)):
        k[i] = k[i][:2] + '0'*(8*m+2 - len(k[i])) + k[i][2:len(k[i])]
    return k


def Hist(image):
    a=[0]*256
    h=image.shape[0]
    w=image.shape[1]
    MN=h*w
    average=0.0
    for i in range(w):
        for j in range(h):
            pixel=int(image[j][i])
            a[pixel]=a[pixel]+1
    for i in range(256):
        a[i]=a[i]/float(MN)
        average=average+a[i]*i
    return a, average


#解析多阈值基因串
def getTh(seed, m):
    th = [0, 256]
    seedInt = long(seed, 2)
    for i in range(0, m):
        tmp = seedInt & 255
        if tmp != 0:
            th.append(tmp)
        seedInt = seedInt >> 8
    th.sort()
    return th


#适应度函数 Ostu全局算法
def fitness(seed, p, average, m):
    Var = [0.0] * len(seed)
    g_muT = 0.0

    for i in range(256):
        g_muT = g_muT + i * p[i]

    for i in range(len(seed)):
        th = getTh(seed[i], m)
        for j in range(len(th)-1):
            w = [0.0] * (len(th)-1)
            muT = [0.0] * (len(th)-1)
            mu = [0.0] * (len(th)-1)
            for k in range(th[j], th[j+1]):
                w[j] = w[j] + p[k]
                muT[j] = muT[j] +  + p[k] * k
            if w[j] > 0:
                mu[j] = muT[j] / w[j]
                Var[i] = Var[i] + w[j] * pow(mu[j] - g_muT, 2)
    return Var


#选择算子 轮盘赌选择算法
def wheel_selection(seed, Var):
    var = [0.0]*len(Var)
    s = 0.0
    n = ['']*len(seed)
    sumV = sum(Var)
    for i in range(len(Var)):
        var[i] = Var[i]/sumV
    for i in range(1, len(Var)):
        var[i] = var[i] + var[i-1]
    for i in range(len(seed)):
        s = random.random()
        for j in range(len(var)):
            if s <= var[j]:
                n[i] = seed[j]
    return n


#单点交叉算子
def Cross(Next, m):
    for i in range(0, len(Next) - 1, 2):
        if random.random() < 0.7:
            if m > 2:
                tmp = Next[i][10:]
                Next[i] = Next[i][:10] + Next[i+1][10:]
                Next[i+1] = Next[i+1][:10] + tmp
            else:
                tmp = Next[i][6:]
                Next[i] = Next[i][:6] + Next[i+1][6:]
                Next[i+1] = Next[i+1][:6] + tmp
    return Next


#变异算子
def Variation(Next):
   for i in range(len(Next)):
        if random.random()<0.06:
            Next[i]=bin(long(Next[i],2)+2)
   return Next


#多阈值分割
def genetic_thres(image, k, m):
    th = image
    for i in range(image.shape[0]):
        for j in range(image.shape[1]):
            for t in range(1, len(k)-1):
                if k[t-1] <= image[i][j] < k[t]:
                    th[i][j] = int(k[t-1])
    return th


# main
imagesrc = cv2.imread("E:/python/cv/OTSU/test2.jpg")
gray = cv2.cvtColor(imagesrc, cv2.COLOR_BGR2GRAY)

m = 3  #阈值数
items_x = range(0, imagesrc.shape[0])
items_y = range(0, imagesrc.shape[1])
random.shuffle(items_x)
random.shuffle(items_y)
x = items_x[0:20*m]  #产生随机x坐标
y = items_y[0:20*m]  #产生随机y坐标
seed = []
Var = 0.0
times = 0
k = 0
P, average = Hist(gray)  #计算直方图,P为各灰度的概率的数组,average为均值
for i in range(0, 20):
    code = long(0)
    for j in range(0, m):
        code = code + gray[x[i*j]][y[i*j]] << j*8  #将阈值连起来组成一个8*m比特的基因串
    seed.append(bin(code))  #生成第一代

while times < 2000:
    Var = fitness(seed, P, average, m)
    Next = wheel_selection(seed, Var)
    Next = Cross(Next, m)
    Next = expand(Variation(Next), m)
    seed = Next
    times = times + 1

for j in range(len(Var)):
    if Var[j] == max(Var):
        k = getTh(Next[j], m)
print k

plt.subplot(131), plt.imshow(imagesrc, "gray")
plt.title("source image"), plt.xticks([]), plt.yticks([])
plt.subplot(132), plt.hist(imagesrc.ravel(), 256)
plt.title("Histogram"), plt.xticks([]), plt.yticks([])
th1 = genetic_thres(gray, k, m)
plt.subplot(133), plt.imshow(th1, "gray")
titleName = ''
for i in range(1, len(k)-1):
    titleName = titleName + str(k[i]) + ', '
titleName = titleName[:len(titleName)-2]
plt.title("threshold is " + titleName), plt.xticks([]), plt.yticks([])
plt.show()
这里使用的是标准二进制,若使用格雷码,应该能收敛得更好。结果如下所示:
![]()
参考:
https://blog.csdn.net/shawroad88/article/details/87965784
https://blog.csdn.net/u010128736/article/details/52801310
