Matplotllib——绘制复杂函数图与三维图
一、绘制二维函数图
1.1 绘制 f(x)=sin2(x−2)e−x2 f ( x ) = s i n 2 ( x − 2 ) e − x 2 函数图
代码1:
import matplotlib.pyplot as plt
import numpy as np
plt.rcParams["font.sans-serif"]=['SimHei']  # 用于正常显示中文标签
plt.rcParams['axes.unicode_minus']=False    # 用来正常显示负号

x = np.linspace(-2.5,2,256,endpoint=True)   # 绘制X轴(-2.5,2)的图像

f =(np.sin(x-2))**2*(np.e)**(-x**2)         # y值

plt.plot(x,f,"g-",lw=2.5,label="f(x)")
plt.title('f(x) = sin^2(x-2)e^{-x^2}函数图')
plt.legend()
plt.show()

_______________________________________________
代码2(对于复杂函数,我们可以将其拆分成多单一函数)
        分析:sin^2(x-2)e^{-x^2}分解:
             sin(x1)*sin(x1)*e^x2
        其中:x1 = x-2;    x2 = -x^2
import matplotlib.pyplot as plt
import numpy as np
plt.rcParams['font.sans-serif'] = ['SimHei']  # 用来正常显示中文标签
plt.rcParams['axes.unicode_minus'] = False    # 用来正常显示负号

x = np.linspace(0, 2,300, endpoint=True)
x_1 = x-2
S_1 = np.sin(x_1)
S_2 = S_1**2

E_1 = -x**2
E_2 = np.exp(E_1)
f = S_2*E_2
plt.figure(figsize = ((8,6)))     # 设置画布大小(可省略)

plt.plot(x,f,'b-',lw=2.5,label='f(x)=sin^2(x-2)e^{-x^2}')

plt.legend()                      # 显示图例
plt.show()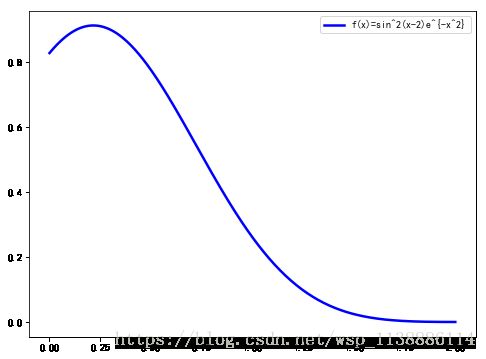
1.2 、绘制 sigmoid函数图: f(x)=11+e−x f ( x ) = 1 1 + e − x
import matplotlib.pyplot as plt
import numpy as np
plt.rcParams['font.sans-serif'] = ['SimHei']  # 用来正常显示中文标签
plt.rcParams['axes.unicode_minus'] = False    # 用来正常显示负号

x = np.linspace(-10, 10,300, endpoint=True)

E_1 = -x
E_2 = np.exp(E_1)
f = 1/(1+E_2)
plt.figure(figsize = ((8,6)))     # 设置画布大小(可省略)
ax1 = plt.subplot(111)

plt.plot(x,f,'b-',lw=2.5,label='f(x)=\\frac{1}{1+e^{-x}}')

plt.legend()                      # 显示图例
ax1.grid(True)                    # 显示网格
plt.show()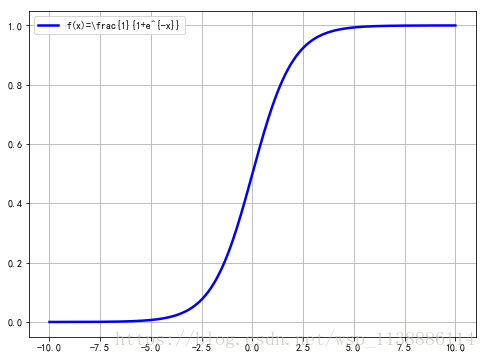
1.3、绘制正态分布图
其中 s 为 σ σ , m为 μ μ
import math
import matplotlib.pyplot as plt
import numpy as np
def gd(x,m,s):                       #其中s为sigma ,m为 mu
    left=1/(math.sqrt(2*math.pi)*s)
    right=math.exp(-math.pow(x-m,2)/(2*math.pow(s,2)))
    return left*right
def showfigure():
    plt.figure(figsize = ((8,6)))   #设置画布大小(可省略)
    x=np.arange(-4,5,0.1)           #绘制x(-4,5)
    y=[]
    for i in x:
        y.append(gd(i,0,1))         #m为0,s为1
    plt.plot(x,y)
    plt.xlim(-4.0,5.0)
    plt.ylim(-0.2,0.5)
    ax = plt.gca()
    ax.spines['right'].set_color('none')
    ax.spines['top'].set_color('none')
    ax.xaxis.set_ticks_position('bottom')
    ax.spines['bottom'].set_position(('data',0))
    ax.yaxis.set_ticks_position('left')
    ax.spines['left'].set_position(('data',0))

    #设置并添加标签
    label_f1 = "$\mu=0,\ \sigma=1$"
    plt.text(2.5,0.3,label_f1,fontsize=15,verticalalignment="top",
            horizontalalignment="left")
    label_f2 = r"$f(x)=\frac{1}{\sqrt{2\pi}\sigma}exp(-\frac{(x-\mu)^2}{2\sigma^2})$"
    plt.text(1.5,0.4,label_f2,fontsize=15,verticalalignment="top"
            ,horizontalalignment="left")
    plt.show()

def main():
    showfigure()
    gd()
main()
二、绘制三维图
2.1 绘制三维螺旋图
from mpl_toolkits.mplot3d import Axes3D
import numpy as np
import matplotlib.pyplot as plt

fig = plt.figure(figsize = ((8,6)))
ax = fig.add_subplot(1,1,1,projection='3d')
theta = np.linspace(-4 * np.pi, 4 * np.pi, 500) # theta旋转角从-4pi到4pi,相当于两圈
z = np.linspace(0, 2, 500)  # z轴从下到上,从-2到2之间画100个点
r = z                       # 半径设置为z大小
x = r * np.sin(theta)       # x和y画圆
y = r * np.cos(theta)       # x和y画圆
ax.plot(x, y, z, label='curve')
ax.legend()                 # 图例

plt.show()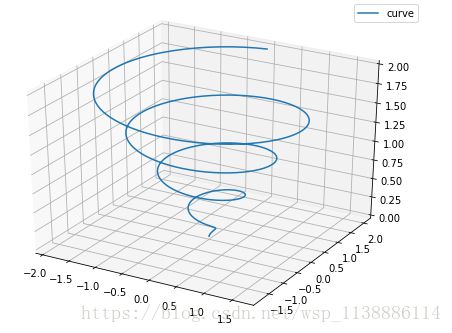
2.2 绘制三维线性点图
from mpl_toolkits.mplot3d import Axes3D
import numpy as np
import matplotlib.pyplot as plt

fig = plt.figure()
ax = fig.add_subplot(1,1,1,projection='3d')
x = np.linspace(0, 5, 10)      # 在0-5之间生成10个点的向量
y = np.linspace(0, 5, 10)      # 在0-5之间生成10个点的向量
z1 = x
z2 = 2*x
z3 = 3*x
ax.scatter(xx, yy, zz1, c='red', marker='o')   # o型符号
ax.scatter(xx, yy, zz2, c='green', marker='^') # 三角型符号
ax.scatter(xx, yy, zz3, c='black', marker='*') # 星型符号
ax.legend()                                    # 显示图例

plt.show()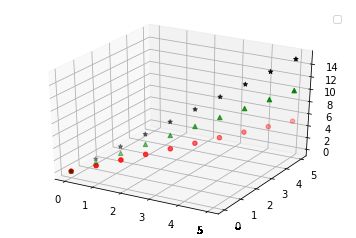
2.3 绘制三维柱状图
import random
import matplotlib as mpl
import matplotlib.dates as mdates
from mpl_toolkits.mplot3d import Axes3D
plt.rcParams['font.sans-serif'] = ['SimHei']  # 用来正常显示中文标签
plt.rcParams['axes.unicode_minus'] = False    # 用来正常显示负号

mpl.rcParams['font.size'] = 10

fig = plt.figure(figsize=((8,6)))
ax = fig.add_subplot(111, projection='3d')
for z in [2011, 2012, 2013, 2014]:
    xs = range(1,13)
    ys = 1000 * np.random.rand(12)
    color = plt.cm.Set2(random.choice(range(plt.cm.Set2.N)))
    ax.bar(xs, ys, zs=z, zdir='y', color=color, alpha=0.8)

ax.xaxis.set_major_locator(mpl.ticker.FixedLocator(xs))
ax.yaxis.set_major_locator(mpl.ticker.FixedLocator(ys))
ax.set_xlabel('月份')
ax.set_ylabel('年份')
ax.set_zlabel('销售额 ')
plt.show()
2.4 绘制三维 鞍部 曲面图
import numpy as np
import matplotlib.pyplot as plt
from mpl_toolkits.mplot3d import Axes3D
from matplotlib import cm

n_angles = 1000                #曲面衔接角度(平滑度)
n_radii = 20                   #鞍部半径(1:锐角,20:平滑角)
fig = plt.figure(figsize=((10,10)))
radii = np.linspace(0.125, 1.0, n_radii)
angles = np.linspace(0, 2 * np.pi, n_angles, endpoint=False)
angles = np.repeat(angles[..., np.newaxis], n_radii, axis=1)

x = np.append(0, (radii * np.cos(angles)).flatten())
y = np.append(0, (radii * np.sin(angles)).flatten())

z = np.sin(-x * y)
fig = plt.figure()
ax = fig.gca(projection='3d')
ax.plot_trisurf(x, y, z,
                cmap=cm.jet,    #曲面颜色
                linewidth=0.2)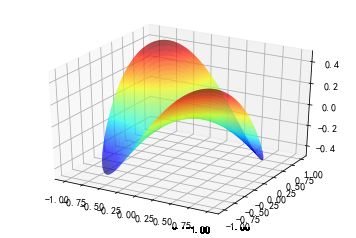
2.5 绘制山区图 f(x,y)=xe−x2−y2 f ( x , y ) = x e − x 2 − y 2
import numpy as np
import matplotlib.pyplot as plt
import mpl_toolkits.mplot3d

x,y = np.mgrid[-2:2:100j,-2:2:100j] #100j为设置曲面平滑度
z=x*np.exp(-x**2-y**2)
ax = plt.subplot(111, projection='3d')
ax.set_title('山区图');
ax.plot_surface(x,y,z,rstride=2, cstride=1, cmap=cm.jet)

ax.set_xlabel('X')                #设置坐标轴标签
ax.set_ylabel('Y')
ax.set_zlabel('Z')
plt.show()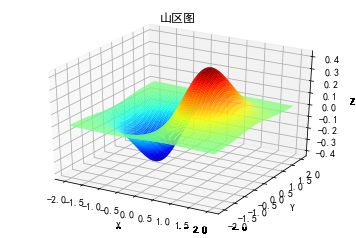
2.6 三维动态图
from pyecharts import Bar3D
bar3d = Bar3D("3D 柱状图示例", width=1200, height=600)

x_axis = ["12a", "1a", "2a", "3a", "4a", "5a", "6a", "7a", "8a", "9a", "10a", "11a",
          "12p", "1p", "2p", "3p", "4p", "5p", "6p", "7p", "8p", "9p", "10p", "11p"]
y_axis = [ "Saturday", "Friday", "Thursday", "Wednesday", "Tuesday", "Monday", "Sunday"]

data = [
    [0, 0, 5], [0, 1, 1], [0, 2, 0], [0, 3, 0], [0, 4, 0], [0, 5, 0],
    [0, 6, 0], [0, 7, 0], [0, 8, 0], [0, 9, 0], [0, 10, 0], [0, 11, 2],
    [0, 12, 4], [0, 13, 1], [0, 14, 1], [0, 15, 3], [0, 16, 4], [0, 17, 6],
    [0, 18, 4], [0, 19, 4], [0, 20, 3], [0, 21, 3], [0, 22, 2], [0, 23, 5],
    [1, 0, 7], [1, 1, 0], [1, 2, 0], [1, 3, 0], [1, 4, 0], [1, 5, 0],
    [1, 6, 0], [1, 7, 0], [1, 8, 0], [1, 9, 0], [1, 10, 5], [1, 11, 2],
    [1, 12, 2], [1, 13, 6], [1, 14, 9], [1, 15, 11], [1, 16, 6], [1, 17, 7],
    [1, 18, 8], [1, 19, 12], [1, 20, 5], [1, 21, 5], [1, 22, 7], [1, 23, 2],
    [2, 0, 1], [2, 1, 1], [2, 2, 0], [2, 3, 0], [2, 4, 0], [2, 5, 0],
    [2, 6, 0], [2, 7, 0], [2, 8, 0], [2, 9, 0], [2, 10, 3], [2, 11, 2],
    [2, 12, 1], [2, 13, 9], [2, 14, 8], [2, 15, 10], [2, 16, 6], [2, 17, 5],
    [2, 18, 5], [2, 19, 5], [2, 20, 7], [2, 21, 4], [2, 22, 2], [2, 23, 4],
    [3, 0, 7], [3, 1, 3], [3, 2, 0], [3, 3, 0], [3, 4, 0], [3, 5, 0],
    [3, 6, 0], [3, 7, 0], [3, 8, 1], [3, 9, 0], [3, 10, 5], [3, 11, 4],
    [3, 12, 7], [3, 13, 14], [3, 14, 13], [3, 15, 12], [3, 16, 9], [3, 17, 5],
    [3, 18, 5], [3, 19, 10], [3, 20, 6], [3, 21, 4], [3, 22, 4], [3, 23, 1],
    [4, 0, 1], [4, 1, 3], [4, 2, 0], [4, 3, 0], [4, 4, 0], [4, 5, 1],
    [4, 6, 0], [4, 7, 0], [4, 8, 0], [4, 9, 2], [4, 10, 4], [4, 11, 4],
    [4, 12, 2], [4, 13, 4], [4, 14, 4], [4, 15, 14], [4, 16, 12], [4, 17, 1],
    [4, 18, 8], [4, 19, 5], [4, 20, 3], [4, 21, 7], [4, 22, 3], [4, 23, 0],
    [5, 0, 2], [5, 1, 1], [5, 2, 0], [5, 3, 3], [5, 4, 0], [5, 5, 0],
    [5, 6, 0], [5, 7, 0], [5, 8, 2], [5, 9, 0], [5, 10, 4], [5, 11, 1],
    [5, 12, 5], [5, 13, 10], [5, 14, 5], [5, 15, 7], [5, 16, 11], [5, 17, 6],
    [5, 18, 0], [5, 19, 5], [5, 20, 3], [5, 21, 4], [5, 22, 2], [5, 23, 0],
    [6, 0, 1], [6, 1, 0], [6, 2, 0], [6, 3, 0], [6, 4, 0], [6, 5, 0],
    [6, 6, 0], [6, 7, 0], [6, 8, 0], [6, 9, 0], [6, 10, 1], [6, 11, 0],
    [6, 12, 2], [6, 13, 1], [6, 14, 3], [6, 15, 4], [6, 16, 0], [6, 17, 0],
    [6, 18, 0], [6, 19, 0], [6, 20, 1], [6, 21, 2], [6, 22, 2], [6, 23, 6]
    ]
range_color = ['#313695', '#4575b4', '#74add1', '#abd9e9', '#e0f3f8', '#ffffbf',
               '#fee090', '#fdae61', '#f46d43', '#d73027', '#a50026']
bar3d.add("", x_axis, y_axis, [[d[1], d[0], d[2]] for d in data],
          is_visualmap=True, visual_range=[0, 20],
          visual_range_color=range_color,
          grid3d_width=200, grid3d_depth=80,
          grid3d_shading='lambert',             #柱状图显示更真实(可省略)
          is_grid3d_rotate=True,                #自动旋转(可省略)
          grid3d_rotate_speed=10)               #旋转速度(可省略)
bar3d.render()
鸣谢:非常感谢以下博主的帮助;
https://blog.csdn.net/sinat_36772813/article/details/77365296
https://blog.csdn.net/eddy_zheng/article/details/48713449
https://blog.csdn.net/dahunihao/article/details/77833877