Leaflet笔记-Leaflet与echarts结合使用(在地图上绘图表)
目录
基本概念
代码与实例
基本概念
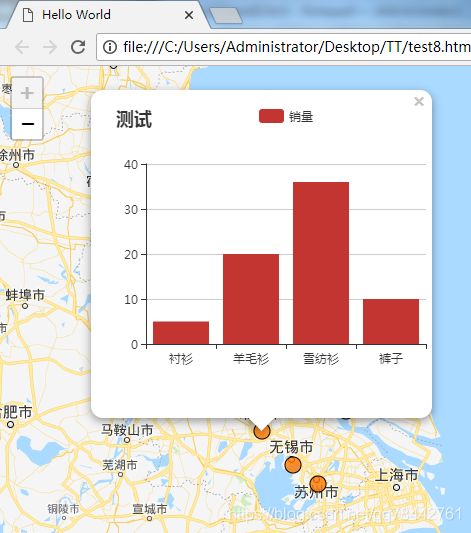
在本地地图上绘制图表,图表经过响应弹出来。
想想真是令人兴奋的事情,到时候用Qt的Widget和QGraphicsView结合QWebEngine搞一层。来一个科技感十足的魔幻页面。
下面来说明下这个逻辑。
使用Leaflet的WMTS接口请求本地Geoserver服务,从而获取数据。然后再把echarts放到Leaflet的响应事件里面。比如框。弹框的时候构造图表。通过这样的方式,即可完成地图上显示图标。
代码与实例
程序运行截图如下:

当选中某一个城市后!
源码如下:
test8.html
Hello World
test6.js
var bicycleRental = {
	"type" : "FeatureConllection",
	"features" : [
		{
			"geometry" : {
				"type" : "Point",
				"coordinates" : [118.8, 32.05],
				"properties" : {
					"popupContent" : "南京",
					"idStr" : "njChart"
				}
			},
			"type" : "Feature",
			"id" : 100
		},
		{
			"geometry" : {
				"type" : "Point",
				"coordinates" : [119.2, 34.55],
				"properties" : {
					"popupContent" : "连云港",
					"idStr" : "lygChart"
				}
			},
			"type" : "Feature",
			"id" : 101
		},
				{
			"geometry" : {
				"type" : "Point",
				"coordinates" : [118.26, 33.94],
				"properties" : {
					"popupContent" : "宿迁",
					"idStr" : "sqChart"
				}
			},
			"type" : "Feature",
			"id" : 102
		},
		{
			"geometry" : {
				"type" : "Point",
				"coordinates" : [119.12, 33.53],
				"properties" : {
					"popupContent" : "淮安",
					"idStr" : "haChart"
				}
			},
			"type" : "Feature",
			"id" : 103
		},
		{
			"geometry" : {
				"type" : "Point",
				"coordinates" : [120.15, 33.32],
				"properties" : {
					"popupContent" : "盐城",
					"idStr" : "ycChart"
				}
			},
			"type" : "Feature",
			"id" : 104
		},
		{
			"geometry" : {
				"type" : "Point",
				"coordinates" : [119.95, 32.40],
				"properties" : {
					"popupContent" : "泰州",
					"idStr" : "tzChart"
				}
			},
			"type" : "Feature",
			"id" : 105
		},
		{
			"geometry" : {
				"type" : "Point",
				"coordinates" : [119.41, 32.35],
				"properties" : {
					"popupContent" : "扬州",
					"idStr" : "yzChart"
				}
			},
			"type" : "Feature",
			"id" : 106
		},
		{
			"geometry" : {
				"type" : "Point",
				"coordinates" : [120.92, 31.94],
				"properties" : {
					"popupContent" : "南通",
					"idStr" : "ntChart"
				}
			},
			"type" : "Feature",
			"id" : 107
		},
		{
			"geometry" : {
				"type" : "Point",
				"coordinates" : [119.99, 31.755],
				"properties" : {
					"popupContent" : "常州",
					"idStr" : "czChart"
				}
			},
			"type" : "Feature",
			"id" : 108
		},
		{
			"geometry" : {
				"type" : "Point",
				"coordinates" : [120.33, 31.44],
				"properties" : {
					"popupContent" : "无锡",
					"idStr" : "wxChart"
				}
			},
			"type" : "Feature",
			"id" : 109
		},
		{
			"geometry" : {
				"type" : "Point",
				"coordinates" : [120.61, 31.26],
				"properties" : {
					"popupContent" : "苏州",
					"idStr" : "szChart"
				}
			},
			"type" : "Feature",
			"id" : 110
		}
	]
}
这里有一个要注意的地方!
echarts他加载的时候需要一个div,并且还得知道这个div的id,如果没有这个将会报错,说dom找不到这个div
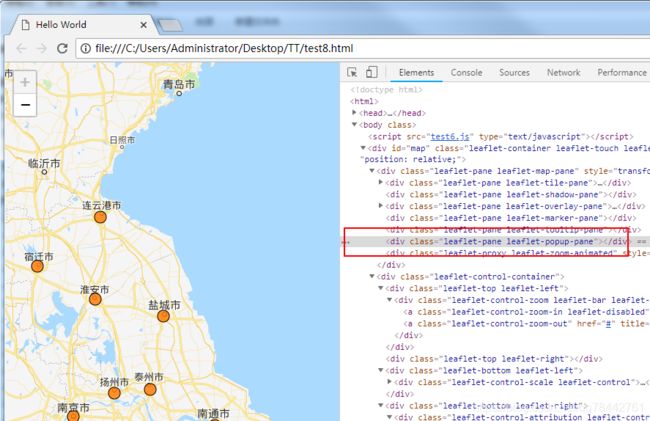
这个弹出的点击小点弹出的功能,是在点击后才创建div的,所以没有点击前相关的dom树如下,当点击后,可以看到此处的结构如下!
