matplotlib.pyplot学习笔记(一)
引入模块并且另名
import matplotlib.pyplot as plt
一、制作简单折线图
| 函数 | 功能 |
|---|---|
| plt.plot(x,y) | x,y可为列表或元组,如果只传入一个列表,则x为缺省值默认为range(len(y)),可用参数linewidth = a来指定线条宽度 |
| plt.title(字符串,fontsize = a) | 设置图表的标题和字体大小 |
| plt.xlabel(字符串,fontsize = a) | 设置x坐标轴标题和字体大小 |
| plt.ylabel(字符串,fontsize = a) | 设置y坐标轴标题和字体大小 |
| plt.tick_params(axis=a,labelsize=b) | 设置坐标轴刻度大小,axis='both’则x,y轴都应用此大小,axis='x’为x轴,axis='y’则为y轴 |
| plt.show() | 打开matplotlib查看器显示绘制图形 |
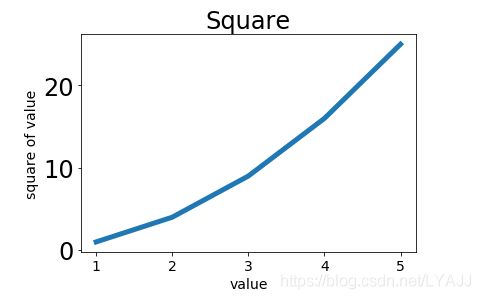
import matplotlib.pyplot as plt

a = (1,4,9,16,25)
b = [1,2,3,4,5]
plt.plot(b,a,linewidth = 5)
plt.title('Square',fontsize = 24)
plt.xlabel('value',fontsize = 14)
plt.ylabel('square of value',fontsize = 14)
plt.tick_params(axis='x',labelsize = 14)
plt.tick_params(axis='y',labelsize = 24)
plt.show()
二、绘制点图
| 函数 | 功能 |
|---|---|
| plt.axis([a,b,c,d]) | 设置x,y轴坐标范围,x为[a,b],y为[c,d] |
| plt.scatter(x,y) | x和y可为单个值,也可为长度相同的列表,另外可指定edgecolor='red’则设置点的边缘为红色,参数c指定颜色,参数cmap指定颜色映射 |
颜色和颜色映射可参考:https://www.cnblogs.com/shanger/p/12040545.html
https://www.jianshu.com/p/299b59c931e8
另外,参数c指定颜色可以传入(1,1,1)对应RGB,越接近1越深。
但是c传入列表或元组,会提示
‘c’ argument looks like a single numeric RGB or RGBA
sequence, which should be avoided as value-mapping will have
precedence in case its length matches with ‘x’ & ‘y’. Please use a
2-D array with a single row if you really want to specify the same RGB
or RGBA value for all points.
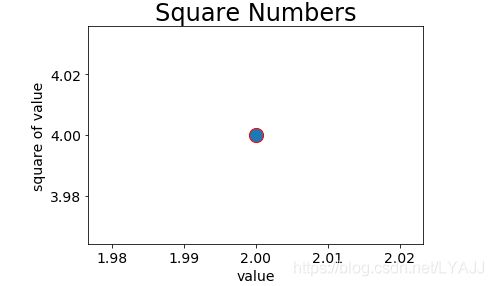
plt.scatter(2,4,s=200,edgecolor='red')
plt.title('Square Numbers',fontsize=24)
plt.xlabel('value',fontsize=14)
plt.ylabel('square of value',fontsize=14)
plt.tick_params(axis='both',labelsize=14)
plt.show()
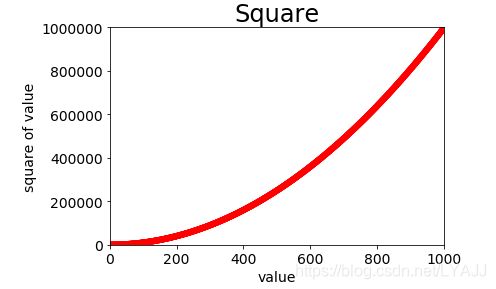
x = list(range(1,1001))
y = [a**2 for a in x]
plt.title('Square',fontsize=24)
plt.xlabel('value',fontsize=14)
plt.ylabel('square of value',fontsize=14)
plt.tick_params(axis='both',labelsize=14)
plt.axis([0,1000,0,1000000])
plt.scatter(x,y,s=40,edgecolor='none',c='red')
plt.show()
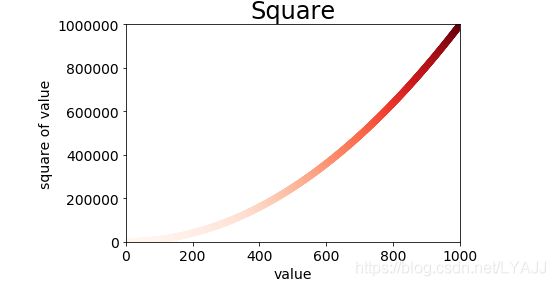
x = list(range(1,1001))
y = [a**2 for a in x]
plt.title('Square',fontsize=24)
plt.xlabel('value',fontsize=14)
plt.ylabel('square of value',fontsize=14)
plt.tick_params(axis='both',labelsize=14)
plt.axis([0,1000,0,1000000])
plt.scatter(x,y,c=y,cmap=plt.cm.Reds)
plt.show()


