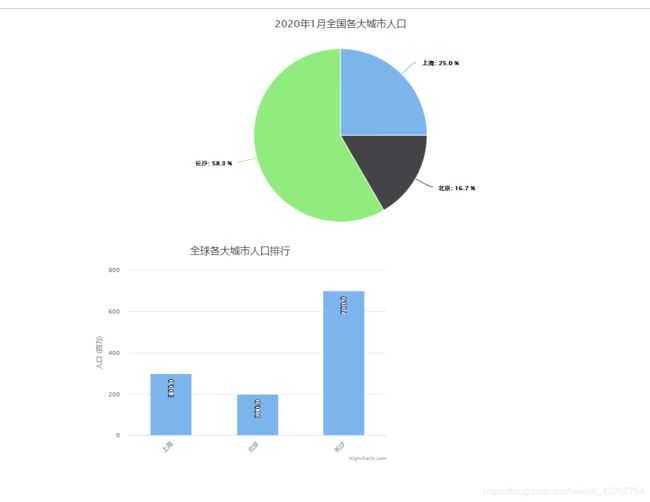
Spring-boot+Highcharts(基本饼图,柱状图)
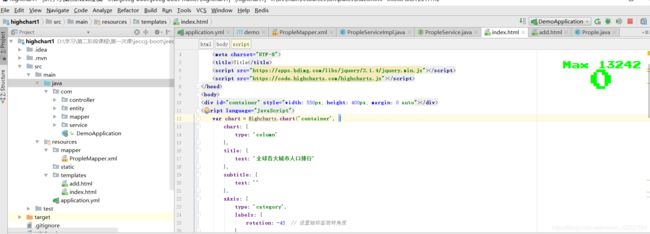
工程结构
最终完成后的工程结构:
下面开始详细的讲解项目的开发过程。
1、新建spring-boot项目
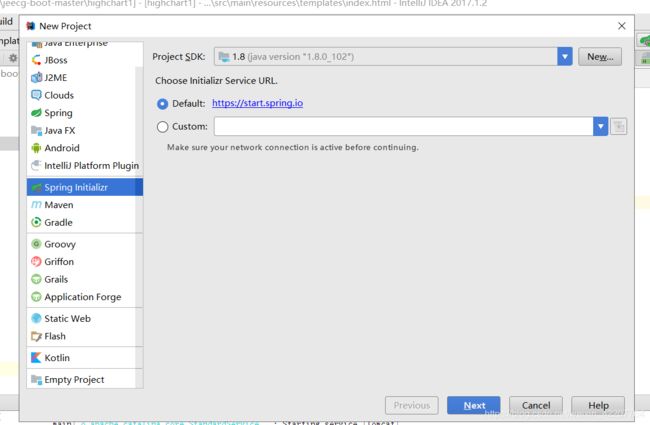
点击next,记得要联网
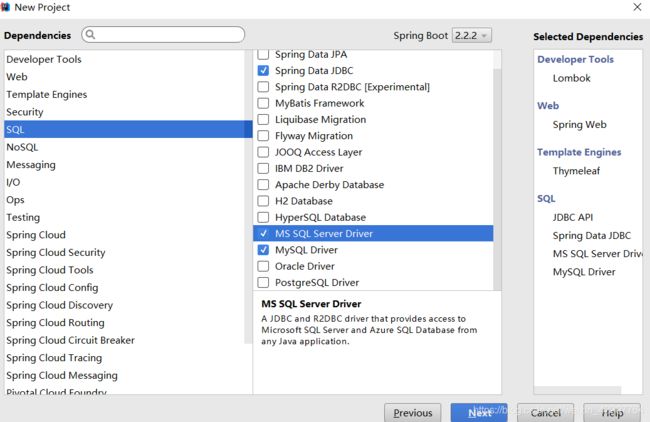
选择这几个jar包
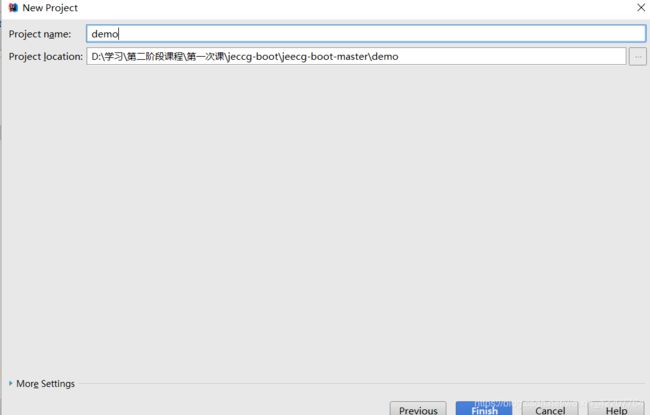
点击Finish完成
2.创建之后的项目如图所示,我们需要在这之上新建一些目录。
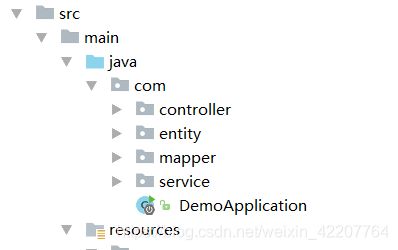
然后在resources包下面把application.properties改成application.yml
2、application.yml配置文件代码:
  server:
    port: 8989
  spring:
    datasource:
      driver-class-name: com.mysql.jdbc.Driver
      url: jdbc:mysql://localhost:3306/jpademo?useUnicode=true&characterEncoding=utf-8&serverTimezone=UTC
      username: root
      password: "0000"
  mybatis:
      mapper-locations: classpath*:mapper/*.xml
  pagehelper:
     helper-dialect: mysql
     params: count=countSql
     reasonable: true
     support-methods-arguments: true
3、自定义java
- 在entity里面创建Prople.java
@Data
public class Prople {
    private int id;
    private String city;
    private int num;
}
- 在mapper包中新建接口 PropleMapper:
@Repository
@Mapper
public interface PropleMapper {
    List<Prople> getCity();
    int sum();


}
- 在service包中新建接口 PropleService:
public interface PropleService {;
    List<Prople> getCity();
    int sum();
}
- 在service包中新建 类 PropleServiceImpl 实现接口:PropleService
@Service
public class PropleServiceImpl implements PropleService {
    @Autowired
    private PropleMapper propleMapper;

    @Override
    public List<Prople> getCity() {
        return propleMapper.getCity();
    }

    @Override
    public int sum() {
        return propleMapper.sum();
    }
}
- 在controller包中新建 类 PropleController:
@Controller
public class PropleController {
    @Autowired
    private PropleService propleService;
    @RequestMapping("/index")
    public String index(){
        return "index";
    }
    @RequestMapping("/add")
    public String add(){
        return "add";
    }
    @RequestMapping("/getCity")
    @ResponseBody
    public List<Prople> getCity(){
        List<Prople> list = propleService.getCity();
        return list;
    }
    @RequestMapping("/getSum")
    @ResponseBody
    public int  getSum(){
        int sum= propleService.sum();
        return sum;
    }
}
- 在resource包下新建 PropleMapper.xml
<?xml version="1.0" encoding="UTF-8"?>
<!DOCTYPE mapper
        PUBLIC "-//mybatis.org//DTD Mapper 3.0//EN"
        "http://mybatis.org/dtd/mybatis-3-mapper.dtd">
<mapper namespace="com.mapper.PropleMapper">
    <select id="getCity" resultType="com.entity.Prople">
        SELECT * FROM prople
    </select>
    <select id="sum" resultType="java.lang.Integer">
        SELECT sum(num) FROM prople
    </select>
</mapper>
3、在resources包下的templates包里新建index.html add.html
- 先导入Highcharts的jar
<script src="https://code.highcharts.com/highcharts.js"></script>
- index页面用来做柱状图 代码如下
<!DOCTYPE html>
<html lang="en">
<head>
    <meta charset="UTF-8">
    <title>Title</title>
    <script src="https://apps.bdimg.com/libs/jquery/2.1.4/jquery.min.js"></script>
        <script src="https://code.highcharts.com/highcharts.js"></script>
</head>
<body>
<div id="container" style="width: 550px; height: 400px; margin: 0 auto"></div>
<script language="JavaScript">
    var chart = Highcharts.chart('container', {
        chart: {
            type: 'column'
        },
        title: {
            text: '全球各大城市人口排行'
        },
        subtitle: {
            text: ''
        },
        xAxis: {
            type: 'category',
            labels: {
                rotation: -45  // 设置轴标签旋转角度
            }
        },
        yAxis: {
            min: 0,
            title: {
                text: '人口 (百万)'
            }
        },
        legend: {
            enabled: false
        },
        tooltip: {
            pointFormat: '人口总量: {point.y:.1f} 百万'
        },
        series: [{
            name: '总人口',
            data:[] ,
            dataLabels: {
                enabled: true,
                rotation: -90,
                color: '#FFFFFF',
                align: 'right',
                format: '{point.y:.1f}', // :.1f 为保留 1 位小数
                y: 10
            }
        }]
    });
    $.post(
        "/getCity",
        function (data) {
            var num=[];
            for(var i=0;i<data.length;i++){
                num.push([data[i].city,data[i].num]);
            }
            chart.series[0].update({
                data:num
            });
        }
    )

</script>

</body>
</html>
- add.html用来做基本饼图 代码如下:
<!DOCTYPE html>
<html lang="en">
<head>
    <meta charset="UTF-8">
    <title>Title</title>
    <script src="https://apps.bdimg.com/libs/jquery/2.1.4/jquery.min.js"></script>
    <script src="https://code.highcharts.com/highcharts.js"></script>
</head>
<body>
<div id="container" style="min-width:400px;height:400px"></div>
<iframe src="index" width="1650px;" style="border: none" height="460px;"></iframe>
</body>
<script language="JavaScript">
   var chart= Highcharts.chart('container', {
        chart: {
            plotBackgroundColor: null,
            plotBorderWidth: null,
            plotShadow: false,
            type: 'pie'
        },
        title: {
            text: '2020年1月全国各大城市人口'
        },
        tooltip: {
            pointFormat: '{series.name}: {point.percentage:.1f}%'
        },
        plotOptions: {
            pie: {
                allowPointSelect: true,
                cursor: 'pointer',
                dataLabels: {
                    enabled: true,
                    format: '{point.name}: {point.percentage:.1f} %',
                    style: {
                        color: (Highcharts.theme && Highcharts.theme.contrastTextColor) || 'black'
                    }
                }
            }
        },
        series: [{
            name: 'Brands',
            colorByPoint: true,
            data: [{
                name: 'Chrome',
                y: 61.41,
                sliced: true,
                selected: true
            }, {
                name: 'Internet Explorer',
                y: 11.84
            }, {
                name: 'Firefox',
                y: 10.85
            }, {
                name: 'Edge',
                y: 4.67
            }, {
                name: 'Safari',
                y: 4.18
            }, {
                name: 'Sogou Explorer',
                y: 1.64
            }, {
                name: 'Opera',
                y: 1.6
            }, {
                name: 'QQ',
                y: 1.2
            }, {
                name: 'Other',
                y: 2.61
            }]
        }]
    });
   $(function () {
       alert("asdasd")
   })
    $.post(
        "/getSum",
    function (sum) {
    $.post(
        "/getCity",
        function (data) {
            var num=[];
            for(var i=0;i<data.length;i++){
                num.push([data[i].city,data[i].num/sum*100]);
            }
            chart.series[0].update({
                data:num
            });
        }
    )
    }
    )
    </script>
    </html >
