使用特征值分解和SVD分解处理图片矩阵并还原重构矩阵
使用特征值分解和SVD分解处理图片矩阵并还原重构矩阵
- 1. 模块导入和图片预处理
- 1.1 导入模块
- 1.2 加载和处理图片
- 1.3 查看图片数组和显示图片
- 2. 小型矩阵测试
- 2.1 使用特征值分解
- 2.2 使用奇异值分解
- 3. 正式图片处理
- 3.1 我们先来尝试用特征值分解
- 3.2 SVD分解并还原重构矩阵
1. 模块导入和图片预处理
1.1 导入模块
#导入绘图模块和矩阵处理模块
from PIL import Image
import numpy as np
import matplotlib.pyplot as plt
1.2 加载和处理图片
#定义图片处理函数
def loadImage(url):
    # 读取图片
    im = Image.open(url)
    #灰度化
    im = im.convert("L")
    #将图片生成数组
    image_data = np.asarray(im)
    return image_data

image_data  = loadImage("images/pic03.jpg")
1.图像转换为矩阵 matrix = numpy.asarray(image)
2.矩阵转换为图像 image = Image.fromarray(matrix)
1.3 查看图片数组和显示图片
image_data
array([[161, 161, 161, ..., 168, 152, 131],
       [161, 161, 160, ..., 169, 155, 133],
       [161, 160, 160, ..., 170, 154, 129],
       ...,
       [ 48,  48,  49, ...,  99, 100, 101],
       [ 48,  48,  49, ..., 102, 105, 107],
       [ 48,  48,  49, ..., 105, 108, 111]], dtype=uint8)
image_data.shape
(512, 512)
plt.imshow(image_data,cmap='gray')
2. 小型矩阵测试
2.1 使用特征值分解
#测试用的矩阵
demo_data = np.array([[1,1,130,1,1],[5,150,220,139,4],[4,249,18,250,3],[5,100,250,98,6],[1,1,130,1,1]])
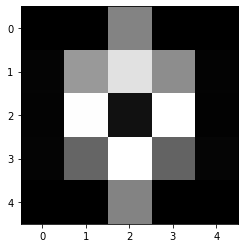
plt.imshow(demo_data,cmap='gray')
#求特征值和特征向量
cvalue,cvector = np.linalg.eig(demo_data)
cvalue
array([ 4.94008077e+02, -2.29280772e+02, -2.42519807e+00,  8.69697506e-15,
        5.69789288e+00])
cvector
array([[-0.15591872, -0.3807619 ,  0.69881489,  0.8992716 ,  0.32946326],
       [-0.58591235, -0.22576077,  0.09769686, -0.06501486, -0.63170598],
       [-0.58159929,  0.68252499, -0.02365501, -0.00354707,  0.00946567],
       [-0.51944941, -0.43958216, -0.11494025,  0.05576873,  0.6194884 ],
       [-0.15591872, -0.3807619 ,  0.69881489, -0.42890667,  0.32946326]])
#定义根据特征值还原的函数
def restore(cvector,cvalue, n, N):
    #求逆矩阵
    cvector1 = np.linalg.inv(cvector)
    #取前n个特征值,生成对角阵
    dia =  np.append(cvalue[0:n],np.zeros(N-n))
    lam_new = np.diag(dia)
    #还原矩阵
    now_image = np.dot(np.dot(cvector,lam_new),cvector1)
    return now_image
- 选全部特征值还原
restore(cvector,cvalue,5,5)
array([[  1.,   1., 130.,   1.,   1.],
       [  5., 150., 220., 139.,   4.],
       [  4., 249.,  18., 250.,   3.],
       [  5., 100., 250.,  98.,   6.],
       [  1.,   1., 130.,   1.,   1.]])
- 选前2个特征值还原
w2 = restore(cvector,cvalue,2,5)
w2
array([[  1.76315344,   2.59799271, 130.01669759,  -1.36543068,
          2.0501414 ],
       [  5.13361385, 146.93056126, 220.9469344 , 141.06003781,
          5.00544282],
       [  3.97334813, 249.046078  ,  17.97069947, 250.00734266,
          2.9383325 ],
       [  4.84771757, 103.01014683, 249.05835103,  96.01274961,
          4.97382364],
       [  1.76315344,   2.59799271, 130.01669759,  -1.36543068,
          2.0501414 ]])
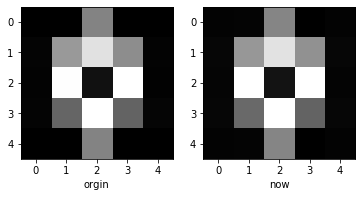
plt.subplot(1,2,1)
plt.imshow(demo_data,cmap='gray')
plt.xlabel("orgin")
plt.subplot(1,2,2)
plt.imshow(w2,cmap='gray')
plt.xlabel("now")
- 发现还原的图片基本上保留了原图的特征
2.2 使用奇异值分解
U,Sigma,V = np.linalg.svd(demo_data, full_matrices=1)
Sigma
array([5.04623689e+02, 2.76409192e+02, 5.80069732e+00, 2.05978309e+00,
       2.19076549e-15])
注意这里的sigma矩阵是一维矩阵,还原时首先要生成其作为对角线的对角阵
#定义svd恢复函数
def resvd(U,Sigma,V,n):
    si = np.diag(Sigma[0:n])
    return U[:,:n]@si@V[:n,:]
#100%还原
w3 = resvd(U,Sigma,V,5)
w3
array([[  1.,   1., 130.,   1.,   1.],
       [  5., 150., 220., 139.,   4.],
       [  4., 249.,  18., 250.,   3.],
       [  5., 100., 250.,  98.,   6.],
       [  1.,   1., 130.,   1.,   1.]])
plt.imshow(w3,cmap='gray')
#取前两个奇异值还原
w4 = resvd(U,Sigma,V,2)
w4
array([[ 1.53122803e+00,  2.16367311e+00,  1.29961911e+02,
        -1.86885877e-01,  1.78340172e+00],
       [ 4.90249998e+00,  1.46825833e+02,  2.20049100e+02,
         1.42182436e+02,  4.69011577e+00],
       [ 4.24435786e+00,  2.50235873e+02,  1.79725146e+01,
         2.48752501e+02,  3.16301924e+00],
       [ 4.51593381e+00,  1.01495187e+02,  2.49998359e+02,
         9.65225041e+01,  4.56633464e+00],
       [ 1.53122803e+00,  2.16367311e+00,  1.29961911e+02,
        -1.86885877e-01,  1.78340172e+00]])
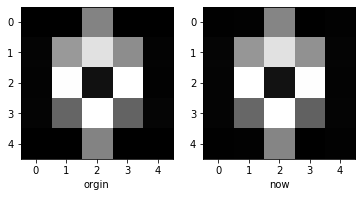
plt.subplot(1,2,1)
plt.imshow(demo_data,cmap='gray')
plt.xlabel("orgin")
plt.subplot(1,2,2)
plt.imshow(w4,cmap='gray')
plt.xlabel("now")
- 发现还原效果与原图几乎一样,可能是原图像素比较低,接下来我们处理像素高、信息多的图片
3. 正式图片处理
通过查阅资料:
- 特征分解相比奇异值分解其应用条件要苛刻得多,特征分解要求矩阵与对角矩阵(可对角化)相似,这在图像上一般是不满足的
- 而奇异值分解适用于任何矩阵,应用范围也就更加广泛,但是奇异值分解本身时间复杂度相当高,随着矩阵规模的增长,计算复杂度将呈立方增长
3.1 我们先来尝试用特征值分解
#先看看我们要处理的图片
plt.imshow(image_data,cmap='gray')
# 计算特征值和特征向量
cha_value,cha_vector = np.linalg.eig(image_data)
cha_value
array([ 6.31940689e+04+0.00000000e+00j, -8.03929061e+03+0.00000000e+00j,
        5.27031308e+03+0.00000000e+00j, -4.35274045e+03+0.00000000e+00j,
        1.31653780e+03+2.64437231e+03j,  1.31653780e+03-2.64437231e+03j,
        ......
        4.58561787e-01+9.28776882e-02j,  4.58561787e-01-9.28776882e-02j,
        5.59703226e-02+3.78031829e-01j,  5.59703226e-02-3.78031829e-01j,
       -1.72117496e-01+3.89324226e-01j, -1.72117496e-01-3.89324226e-01j])
cha_value.shape
(512,)
cha_vector
array([[-0.04870187+0.j        ,  0.00148652+0.j        ,
         0.03914127+0.j        , ..., -0.01392511-0.08843148j,
         0.04003832+0.00911842j,  0.04003832-0.00911842j],
       [-0.04869858+0.j        ,  0.00147211+0.j        ,
         0.03903883+0.j        , ...,  0.01722793+0.03851178j,
        -0.03756849-0.03310897j, -0.03756849+0.03310897j],
       [-0.04869473+0.j        ,  0.00143451+0.j        ,
         0.03884124+0.j        , ..., -0.00707275-0.0008019j ,
         0.07088382-0.01090998j,  0.07088382+0.01090998j],
       ...,
       [-0.04148487+0.j        ,  0.06893779+0.j        ,
        -0.00943626+0.j        , ..., -0.00072898+0.0444966j ,
        -0.08156037-0.08678486j, -0.08156037+0.08678486j],
       [-0.04139138+0.j        ,  0.07030029+0.j        ,
        -0.01074787+0.j        , ...,  0.09199783-0.06395806j,
         0.07602846+0.02662019j,  0.07602846-0.02662019j],
       [-0.04130632+0.j        ,  0.07137667+0.j        ,
        -0.01183001+0.j        , ..., -0.05014964+0.02169388j,
        -0.00777808+0.01356449j, -0.00777808-0.01356449j]])
cha_vector.shape
(512, 512)
- 由于特征值存在复数,而python 不支持复数转换为整数或浮点数,所以接下来采用奇异值分解
3.2 SVD分解并还原重构矩阵
U,Sigma,V = np.linalg.svd(image_data, full_matrices=1)
Sigma
array([6.47863129e+04, 1.06097179e+04, 8.15616672e+03, 6.48027847e+03,
       5.88171483e+03, 5.53885283e+03, 4.57280722e+03, 4.08863670e+03,
       3.36892938e+03, 3.15843979e+03, 2.65792456e+03, 2.44007735e+03,
       ......
       3.10658340e-01, 2.66331019e-01, 2.45874463e-01, 2.29508349e-01,
       2.09154136e-01, 1.72908417e-01, 1.50184655e-01, 9.61525803e-02,
       8.22379370e-02, 6.02098344e-02, 3.84692480e-02, 1.32001603e-02])
#定义列表,元素为取数量从10到180,间隔为20个奇异值还原的矩阵
resvd_image = []
for i in range(10,180,20):
    resvd_image.append(resvd(U,Sigma,V,i))
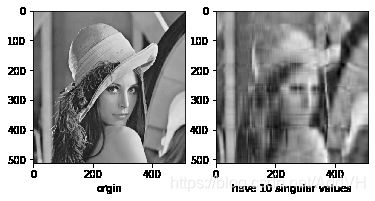
#取前10个奇异值还原
plt.subplot(1,2,1)
plt.imshow(image_data,cmap='gray')
plt.xlabel("orgin")
plt.subplot(1,2,2)
plt.imshow(resvd_image[0],cmap='gray')
plt.xlabel("have 10 singular values")
#取前30个奇异值还原
plt.subplot(1,2,1)
plt.imshow(image_data,cmap='gray')
plt.xlabel("orgin")
plt.subplot(1,2,2)
plt.imshow(resvd_image[1],cmap='gray')
plt.xlabel("have 30 singular values")
#取前50个奇异值还原
plt.subplot(1,2,1)
plt.imshow(image_data,cmap='gray')
plt.xlabel("orgin")
plt.subplot(1,2,2)
plt.imshow(resvd_image[2],cmap='gray')
plt.xlabel("have 50 singular values")
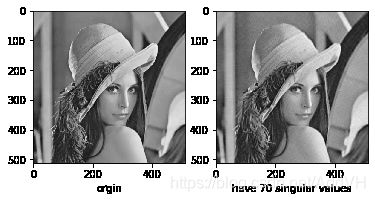
#取前70个奇异值还原
plt.subplot(1,2,1)
plt.imshow(image_data,cmap='gray')
plt.xlabel("orgin")
plt.subplot(1,2,2)
plt.imshow(resvd_image[3],cmap='gray')
plt.xlabel("have 70 singular values")
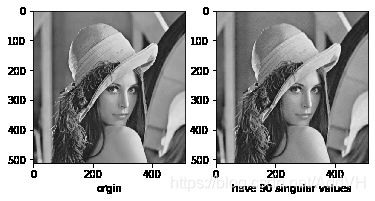
#取前90个奇异值还原
plt.subplot(1,2,1)
plt.imshow(image_data,cmap='gray')
plt.xlabel("orgin")
plt.subplot(1,2,2)
plt.imshow(resvd_image[4],cmap='gray')
plt.xlabel("have 90 singular values")
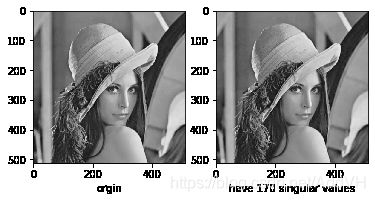
#取前170个奇异值还原
plt.subplot(1,2,1)
plt.imshow(image_data,cmap='gray')
plt.xlabel("orgin")
plt.subplot(1,2,2)
plt.imshow(resvd_image[8],cmap='gray')
plt.xlabel("have 170 singular values")
- 我们发现只要取少量奇异值(大概50到70个奇异值)就能保留原图片中大部分信息

