K-means算法代码详解及Demo
最近比较忙公众号更新的就不太及时,请各位大佬见谅,但是我依旧每天坚持学习。那今天大管就给各位小伙伴献上K-means算法的sklearn使用方法,以及在文章末尾我们使用K-Means算法对图片进行矢量化,即在保证图片质量的前提下来减少图片的使用(可以理解为压缩图片)。想回顾K-Means理论的小伙伴可以点击文章末尾的连接。
K-means
KMeans算法通过试着将样本分离到n组方差相等的情况下对数据进行聚类,使惯性或聚类内平方和最小化。该算法要求指定集群的数量。它可以很好地扩展到大量的样本,并且已经在许多不同领域的广泛应用领域中使用。k-means算法将一组样本分成不相交的簇,每个簇用该簇中样本的均值来描述,这种方法通常被称为簇的“质心”。
步骤
基本来说,该算法有三个步骤。第一步选择初始质心,最基本的方法是从数据集中选择样本。初始化之后,K-means由其他两个步骤之间的循环组成。第一步将每个样本分配到其最近的质心。第二步通过取分配给每个质心的所有样本的平均值来创建新的质心。计算新旧质心之间的差值,算法重复最后两步,直到该值小于阈值。换句话说,它重复,直到质心不明显移动。
#调用函数
class sklearn.cluster.KMeans(n_clusters=8, init='k-means++', n_init=10, max_iter=300, tol=0.0001, precompute_distances='auto', verbose=0, random_state=None, copy_x=True, n_jobs=None, algorithm='auto')
#参数Parameters
## n_clusters : int, optional, default: 8 要聚类的数目即簇数。默认为8.
## init : {‘k-means++’, ‘random’ or an ndarray} 选择初始化方法。
## n_init : int, default: 10 对于不同的初始值,k-means算法的运行时间。
## max_iter : int, default: 300 k-means算法一次运行的最大迭代次数
## tol : float, default: 1e-4 对于收敛的精确度
## precompute_distances : {‘auto’, True, False} 是否要预计算距离,‘auto’自动,建议当样本数大于1200万不要开启。
## verbose : int, default 0 冗长模式
## random_state : int, RandomState instance or None (default) 确定聚类中心初始化的随机数生成。使用int使随机性具有确定性
## copy_x : boolean, optional 在预计算距离时,先将数据中心放在首位是比较精确的
## n_jobs : int or None, optional (default=None) 用于计算的作业数量。这是通过并行计算每个n_init来实现的
## algorithm : “auto”, “full” or “elkan”, default=”auto” 选择算法风格,经典的是full表示稀疏数据,auto选择elkan表示密集数据
#属性Attributes
## cluster_centers_ : array, [n_clusters, n_features] 簇的中心坐标
## labels_ : 每个点的标签
## inertia_ : float 样本到它们最近的簇中心的距离的平方的和
## n_iter_ : int 运行的迭代次数
#代码举例
>>> from sklearn.cluster import KMeans
>>> import numpy as np
>>> X = np.array([[1, 2], [1, 4], [1, 0],
...               [10, 2], [10, 4], [10, 0]])
>>> kmeans = KMeans(n_clusters=2, random_state=0).fit(X)
>>> kmeans.labels_
array([1, 1, 1, 0, 0, 0], dtype=int32)
>>> kmeans.predict([[0, 0], [12, 3]])
array([1, 0], dtype=int32)
>>> kmeans.cluster_centers_
array([[10.,  2.],
       [ 1.,  2.]])
#方法Methods
### fit(X, y=None, sample_weight=None) 根据训练数据来拟合模型
参数Parameters
X : array-like or sparse matrix, shape=(n_samples, n_features) 训练数据集
y : Ignored 不使用
sample_weight : array-like, shape (n_samples,), optional x中每个样本的权重,如果没有,则所有样本的权重相等
### fit_predict(X, y=None, sample_weight=None) 计算预测聚类
参数Parameters
X : array-like or sparse matrix, shape=(n_samples, n_features) 新样本数据集
y : Ignored 不使用
sample_weight : array-like, shape (n_samples,), optional x中每个样本的权重,如果没有,则所有样本的权重相等
返回值Return
abels : array, shape [n_samples,] 每个样本所属聚类的簇
### fit_transform(X, y=None, sample_weight=None) 计算聚类并将X转换为聚类距离空间
参数同上
返回值Return
X_new : array, shape [n_samples, k] X在新的空间中变换
### get_params(deep=True)
返回值Return
params : mapping of string to any 参数名称映射到它们的值
### predict(X, sample_weight=None) 预测X中每个样本所属于的最近的聚类
参数Parameters
X : {array-like, sparse matrix}, shape = [n_samples, n_features] 要预测的样本
sample_weight : array-like, shape (n_samples,), optional 样本的权重
返回值Return
labels : array, shape [n_samples,] 每个样本所属的簇
### score(X, y=None, sample_weight=None) 与k均值目标上的X值相反
参数同上
返回值Return
score : float 与k均值目标上的X值相反
### transform(X) 将X转换为簇距离空间
参数同上
返回值Reutrn
X_new : array, shape [n_samples, k] 装换后的X值
#实例
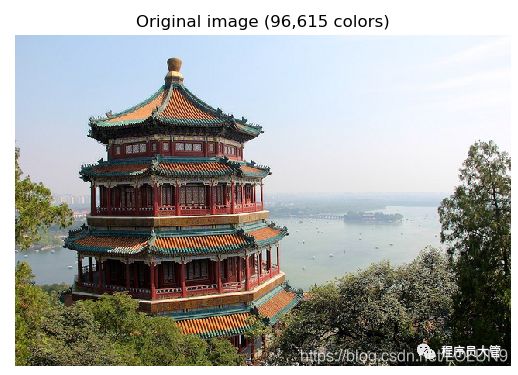
对颐和园(中国)的图像进行像素矢量量化(VQ),将显示图像所需的颜色从96615种减少到64种,同时保持整体外观质量。在本例中,像素在3d空间中表示,使用K-means找到64个颜色簇。在图像处理文献中,K-means(聚类中心)得到的码本称为调色板。使用单个字节,最多可以寻址256种颜色,而RGB编码需要每个像素3个字节。例如,GIF文件格式就使用了这样一个调色板,为了进行比较,还显示了使用随机码本(随机提取的颜色)的量化图像。
import numpy as np
import matplotlib.pyplot as plt
from sklearn.cluster import KMeans
from sklearn.metrics import pairwise_distances_argmin
from sklearn.datasets import load_sample_image
from sklearn.utils import shuffle
from time import time

n_colors = 64

# Load the Summer Palace photo
china = load_sample_image("china.jpg")

# Convert to floats instead of the default 8 bits integer coding. Dividing by
# 255 is important so that plt.imshow behaves works well on float data (need to
# be in the range [0-1])
china = np.array(china, dtype=np.float64) / 255

# Load Image and transform to a 2D numpy array.
w, h, d = original_shape = tuple(china.shape)
assert d == 3
image_array = np.reshape(china, (w * h, d))

print("Fitting model on a small sub-sample of the data")
t0 = time()
image_array_sample = shuffle(image_array, random_state=0)[:1000]
kmeans = KMeans(n_clusters=n_colors, random_state=0).fit(image_array_sample)
print("done in %0.3fs." % (time() - t0))

# Get labels for all points
print("Predicting color indices on the full image (k-means)")
t0 = time()
labels = kmeans.predict(image_array)
print("done in %0.3fs." % (time() - t0))


codebook_random = shuffle(image_array, random_state=0)[:n_colors]
print("Predicting color indices on the full image (random)")
t0 = time()
labels_random = pairwise_distances_argmin(codebook_random,
                                          image_array,
                                          axis=0)
print("done in %0.3fs." % (time() - t0))


def recreate_image(codebook, labels, w, h):
    """Recreate the (compressed) image from the code book & labels"""
    d = codebook.shape[1]
    image = np.zeros((w, h, d))
    label_idx = 0
    for i in range(w):
        for j in range(h):
            image[i][j] = codebook[labels[label_idx]]
            label_idx += 1
    return image

# Display all results, alongside original image
plt.figure(1)
plt.clf()
plt.axis('off')
plt.title('Original image (96,615 colors)')
plt.imshow(china)

plt.figure(2)
plt.clf()
plt.axis('off')
plt.title('Quantized image (64 colors, K-Means)')
plt.imshow(recreate_image(kmeans.cluster_centers_, labels, w, h))

plt.figure(3)
plt.clf()
plt.axis('off')
plt.title('Quantized image (64 colors, Random)')
plt.imshow(recreate_image(codebook_random, labels_random, w, h))
plt.show()
下图显示的是处理前,处理后以及随机选取出出力后的图片。可以明显看到k-means算法处理后的图片还原度更高,而随机处理后图片在颜色上有了很大的失真。
内容下载机器学习资料请扫描下方二维码关注小编公众号:程序员大管
![]()


