R 3D可视化 初阶
3D Surface Plots
一个还好的R Blog http://yixuan.cos.name/cn/categories/#R-ref
R语言能否画三维图? http://www.zhihu.com/question/26863301
plotting 3D data in R http://stackoverflow.com/questions/6720526/plotting-3d-data-in-r
3D Plots in R http://blog.revolutionanalytics.com/2014/02/3d-plots-in-r.html
plot3D https://cran.r-project.org/web/packages/plot3D/vignettes/plot3D.pdf
Creating 3D Surface plots in R http://www.wekaleamstudios.co.uk/wp-content/uploads/2010/05/graphs-surfaceplots.pdf
R语言绘制三维图 http://wenku.baidu.com/link?url=N1DOQgGGP1t_LRwFHc60okX-P_0YC3oROfxfYvgzkn7ntKtr_QU5OUmpYEJBBXSFUWIS2DGnbeuqn0S4q00WJNHQx-TqdvBtLD3jwh0H0ya
用R绘制交互式3D图 http://blog.csdn.net/chszs/article/details/8014970
看了上面这么多的资料,今天的主题就是要生成交互式3D图。
这个文章中有个代码里的rand好像没有这个函数,不能重复。我也是初学所以修正不了。有哪位可以修正请留言,谢谢啊。
用R绘制交互式3D图 http://blog.csdn.net/chszs/article/details/8014970
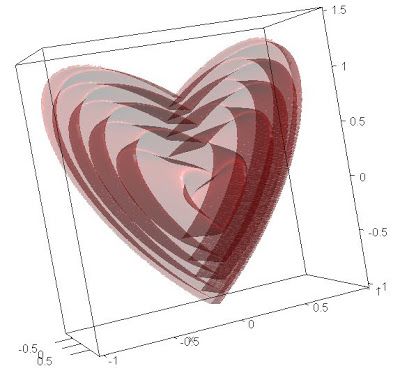
先贴两个好看的心,有兴趣可以照着做一下。

我的中国心® http://yixuan.cos.name/cn/2009/10/my-heart-for-china/

用RGL包绘制三维交互式图形 https://www.r-bloggers.com/lang/chinese/997
一、rgl
1.安装package
> install.packages(“rgl”)
configure: error: X11 not found but required, configure aborted.
ERROR: configuration failed for package ‘rgl’
* removing ‘/home/xyz/R/x86_64-pc-linux-gnu-library/3.3/rgl’
Warning in install.packages :
installation of package ‘rgl’ had non-zero exit status
Solution :
sudo apt-get install freeglut3 freeglut3-dev
(Thanks http://www.louisaslett.com/RStudio_AMI/)
> install.packages(“evd”)
> install.packages(“MASS”)
2.Show
z <- c(
  c(8.83,8.89,8.81,8.87,8.9,8.87),
  c(8.89,8.94,8.85,8.94,8.96,8.92),
  c(8.84,8.9,8.82,8.92,8.93,8.91),
  c(8.79,8.85,8.79,8.9,8.94,8.92),
  c(8.79,8.88,8.81,8.9,8.95,8.92),
  c(8.8,8.82,8.78,8.91,8.94,8.92),
  c(8.75,8.78,8.77,8.91,8.95,8.92),
  c(8.8,8.8,8.77,8.91,8.95,8.94),
  c(8.74,8.81,8.76,8.93,8.98,8.99),
  c(8.89,8.99,8.92,9.1,9.13,9.11),
  c(8.97,8.97,8.91,9.09,9.11,9.11),
  c(9.04,9.08,9.05,9.25,9.28,9.27),
  c(9,9.01,9,9.2,9.23,9.2),
  c(8.99,8.99,8.98,9.18,9.2,9.19),
  c(8.93,8.97,8.97,9.18,9.2,9.18)
)
x <- 1:6
y <- 1:15
dim(z) <- c(15,6)
persp3d(x, y, z, col="skyblue")
二、plotly
1.安装package
> install.packages(“plotly”)
ERROR: dependency ‘httr’ is not available for package ‘plotly’
* removing ‘/home/xyz/R/x86_64-pc-linux-gnu-library/3.3/plotly’
Warning in install.packages :
installation of package ‘plotly’ had non-zero exit status
Solution :
unbutu:
sudo apt-get install libcurl4-gnutls-dev
using CentOS: (未验证):
sudo yum -y install libcurl libcurl-devel
(Thanks http://stackoverflow.com/questions/20923209/problems-installing-the-devtools-package)
2.Show更炫的例子
z <- c(
  c(8.83,8.89,8.81,8.87,8.9,8.87),
  c(8.89,8.94,8.85,8.94,8.96,8.92),
  c(8.84,8.9,8.82,8.92,8.93,8.91),
  c(8.79,8.85,8.79,8.9,8.94,8.92),
  c(8.79,8.88,8.81,8.9,8.95,8.92),
  c(8.8,8.82,8.78,8.91,8.94,8.92),
  c(8.75,8.78,8.77,8.91,8.95,8.92),
  c(8.8,8.8,8.77,8.91,8.95,8.94),
  c(8.74,8.81,8.76,8.93,8.98,8.99),
  c(8.89,8.99,8.92,9.1,9.13,9.11),
  c(8.97,8.97,8.91,9.09,9.11,9.11),
  c(9.04,9.08,9.05,9.25,9.28,9.27),
  c(9,9.01,9,9.2,9.23,9.2),
  c(8.99,8.99,8.98,9.18,9.2,9.19),
  c(8.93,8.97,8.97,9.18,9.2,9.18)
)
x <- 1:6
y <- 1:15
dim(z) <- c(15,6)
z2 <- z + 1
z3 <- z - 1
plot_ly(showscale = FALSE) %>%
  add_surface(z = ~z) %>%
  add_surface(z = ~z2, opacity = 0.98) %>%
  add_surface(z = ~z3, opacity = 0.98)
三、Show surface wave
dir <- "/home/xyz/Documents/Final Test/awp code/awp-odc-os-master/run/out_sfc"
setwd(dir);
X <- 75;
Y <- 75;
z <- array(0.0, dim=c(X, Y));

f_mesh <- file("SX0000620", "rb")

for(j in 1:Y){
    for(i in 1:X){
        z[i,j] <- readBin(f_mesh, numeric(),  size=4);
    }
}
z1 <- z* 1.0

plot_ly(showscale = FALSE) %>%
  add_surface(z = ~z1)

rm(z, z1);
rm(X,Y)
rm(i,j,k)
close(f_mesh)
铛铛铛铛,结果就是:

如何上传数据呢?我还不知道呢。但是我已经把数据放在baidu pan上了,希望能很长时间的保留。
https://pan.baidu.com/s/1qXT3EzU