数据挖掘实列几则(K-means/Mean-Shift/EM)
一、数据认知
此次实验分配的任务为数据聚类,涉及数据集为三组,名称分别为“Seeds Data Set”,“Diabetes 130-US Hospitals for Years 1999-2008 Data Set”与“Dow Jones Index Data Set”。接下来依次介绍三个数据集的详细信息。
-
-
Seeds Data Set
-
“Seeds Data Set”是对三种不同品种的小麦籽粒几何形状进行描述的数据集,它构建了七个实值属性。该数据集应聚为三类不同品种的小麦籽粒种类,分别名为“Kama”、“Rosa”与“Canadian”,在该数据集中每种实列数各为70。该数据集的基本情况如表1.1所示。
表1.1 Seeds Data Set数据集基本情况
| 数据集特点: |
多元 |
实例数量: |
210 |
领域: |
生活类 |
| 属性特征: |
真实 |
属性数量: |
7 |
上传日期: |
2012.9.29 |
| 相关任务: |
分类/聚类 |
缺值: |
N/A |
浏览次数: |
214401 |
该数据集的7个几何属性分别如表1.2所示。其中紧凑度C的计算公式为:![]()
其中A为籽粒面积,P为籽粒周长。
表1.2 Seeds Data Set数据集属性中英文对照表
| 属性中文名 |
属性英文名 |
| 面积 |
Area,A |
| 周长 |
Perimeter,P |
| 紧凑度 |
Compactness,C |
| 籽粒长度 |
Length of kernel |
| 籽粒宽度 |
Width of kernel |
| 不对称系数 |
Asymmetry coefficient |
| 核槽长度 |
Length of kernel groove |
-
-
Diabetes 130-US Hospitals for Years 1999-2008 Data Set
-
“Diabetes 130-US Hospitals for Years 1999-2008 Data Set”是对1999至2008年间不同经过医院实验室测试的十万名糖尿病患者进行描述的数据集,它经过临床专家的筛选后仅保留了55个最可能与糖尿病病情相关的属性。该数据集的基本情况如表1.3所示。
表1.3 Diabetes 130-US Hospitals for Years 1999-2008 Data Set数据集基本情况
| 数据集特点: |
多元 |
实例数量: |
100000 |
领域: |
生活类 |
| 属性特征: |
整数 |
属性数量: |
55 |
上传日期: |
2014.5.3 |
| 相关任务: |
分类/聚类 |
缺值: |
是 |
浏览次数: |
21200 |
该数据集的55个属性分别如表1.4所示。其中的“24 features for medications”一栏中包含了24种药物的施药状况,如二甲双胍、瑞格列奈、那格列奈、氯丙帕胺等共24个属性值。详细的24种药物专有名词见表1.4该栏的属性描述单元格。
表1.4 Diabetes 130-US Hospitals for Years 1999-2008 Data Set数据集属性描述
| 属性英文名 |
属性描述 |
| Encounter ID |
Unique identifier of an encounter |
| Patient number |
Unique identifier of a patient |
| Race |
Values: Caucasian, Asian, African American, Hispanic, and other |
| Gender |
Values: male, female, and unknown/invalid |
| Age |
Grouped in 10-year intervals |
| Weight |
Weight in pounds |
| Admission type |
Integer identifier corresponding to 9 distinct values, for example, emergency, urgent, elective, newborn, and not available |
| Discharge disposition |
Integer identifier corresponding to 29 distinct values, for example, discharged to home, expired, and not available |
| Admission source |
Integer identifier corresponding to 21 distinct values, for example, physician referral, emergency room, and transfer from a hospital |
| Time in hospital |
Integer number of days between admission and discharge |
| Payer code |
Integer identifier corresponding to 23 distinct values, for example, Blue Cross/Blue Shield, Medicare, and self-pay |
| Medical specialty |
Integer identifier of a specialty of the admitting physician, corresponding to 84 distinct values, for example, cardiology, internal medicine, family/general practice, and surgeon |
| Number of lab procedures |
Number of lab tests performed during the encounter |
| Number of procedures |
Number of procedures (other than lab tests) performed during the encounter |
| Number of medications |
Number of distinct generic names administered during the encounter |
| Number of outpatient visits |
Number of outpatient visits of the patient in the year preceding the encounter |
| Number of emergency visits |
Number of emergency visits of the patient in the year preceding the encounter |
| Number of inpatient visits |
Number of inpatient visits of the patient in the year preceding the encounter |
| Diagnosis 1 |
The primary diagnosis (coded as first three digits of ICD9); 848 distinct values |
| Diagnosis 2 |
Secondary diagnosis (coded as first three digits of ICD9); 923 distinct values |
| Diagnosis 3 |
Additional secondary diagnosis (coded as first three digits of ICD9); 954 distinct values |
| Number of diagnoses |
Number of diagnoses entered to the system |
| Glucose serum test result |
Indicates the range of the result or if the test was not taken. Values: “>200,” “>300,” “normal,” and “none” if not measured |
| A1c test result |
Indicates the range of the result or if the test was not taken. Values: “>8” if the result was greater than 8%, “>7” if the result was greater than 7% but less than 8%, “normal” if the result was less than 7%, and “none” if not measured. |
| Change of medications |
Indicates if there was a change in diabetic medications (either dosage or generic name). Values: “change” and “no change” |
| Diabetes medications |
Indicates if there was any diabetic medication prescribed. Values: “yes” and “no” |
| 24 features for medications |
For the generic names: metformin, repaglinide, nateglinide, chlorpropamide, glimepiride, acetohexamide, glipizide, glyburide, tolbutamide, pioglitazone, rosiglitazone, acarbose, miglitol, troglitazone, tolazamide, examide, sitagliptin, insulin, glyburide-metformin, glipizide-metformin, glimepiride-pioglitazone, metformin-rosiglitazone, and metformin-pioglitazone, the feature indicates whether the drug was prescribed or there was a change in the dosage. Values: “up” if the dosage was increased during the encounter, “down” if the dosage was decreased, “steady” if the dosage did not change, and “no” if the drug was not prescribed |
| Readmitted |
Days to inpatient readmission. Values: “<30” if the patient was readmitted in less than 30 days, “>30” if the patient was readmitted in more than 30 days, and “No” for no record of readmission. |
-
-
Dow Jones Index Data Set
-
“Dow Jones Index Data Set”是对2013年1至6月特定的公司道格琼斯指数每周股票数据进行描述的数据集。其中第一季度(1至3月)可以作为训练集使用,第二季度(4至6月)可以作为测试集使用,它共有16个属性。该数据集的基本情况如表1.5所示。
表1.3 Dow Jones Index Data Set数据集基本情况
| 数据集特点: |
多元 |
实例数量: |
750 |
领域: |
经济类 |
| 属性特征: |
真实 |
属性数量: |
16 |
上传日期: |
2013 |
| 相关任务: |
分类/聚类 |
缺值: |
N/A |
浏览次数: |
- |
该数据集的16个属性及其属性描述如图1.6所示。
表1.6 Dow Jones Index Data Set数据集属性描述
| 属性英文名 |
属性描述 |
| Quarter |
the yearly quarter (1 = Jan-Mar; 2 = Apr=Jun) |
| Stock |
the stock symbol |
| Date |
the last business day of the work |
| Open |
the price of the stock at the beginning of the week |
| High |
the highest price of the stock during the week |
| Low |
the lowest price of the stock during the week |
| Close |
the price of the stock at the end of the week |
| Volume |
the number of shares of stock that traded hands in the week |
| Percent change price |
the percentage change in price throughout the week |
| Percent change volume or last week |
the percentage change in the number of shares of stock that traded hands for this week compared to the previous week |
| Previous weeks volume |
the number of shares of stock that traded hands in the previous week |
| Next weeks open |
the opening price of the stock in the following week |
| Next weeks close |
the closing price of the stock in the following week |
| Percent change next weeks price |
the percentage change in price of the stock in the following week the number |
| Following week days to next dividend |
the number of days until the next dividend |
| Percent return next dividend |
the percentage of return on the next dividend |
二、数据预处理
此次实验使用Python作为编程语言进行数据处理与挖掘。使用的版本为Python 3.6。由于数据集内容并非完全规整,在数据导入阶段需要根据数据集的特点进行不同的数据预处理。
2.1 Seeds Data Set的数据预处理
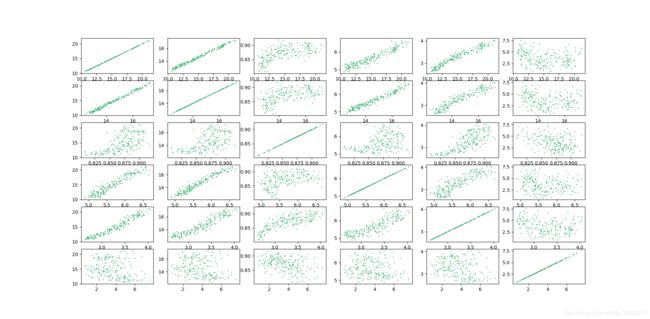
首先检查数据文本,未发现空缺数据,之后导入“Seeds Data Set”的数据并两两属性交叉对其进行绘图观察,绘制的散点图如图2.1所示。从图中能够看出该数据集的数据较为规整,未出现噪音数据及离群数据。又因为该数据集实列数较少、属性值数较少,故在导入数据时可直接导入,不对其进行预处理。
图2.1 Seed Data Set数据散点图
绘制图2.1使用了Python中的matplotlib.pyplot包,使用版本为2.0.2。绘制代码如下:
def show_seed():
figure, ax = plt.subplots(6, 6)
for i in range(0, 6):
for j in range(0, 6):
Y = np.array(seeds_values[:, [i, j]])
for l in range(0, 210):
ax[i][j].scatter(Y[l][0], Y[l][1], s=1, color='mediumseagreen')
print(Y)
print("___")
plt.show()
2.2 Diabetes 130-US Hospitals for Years 1999-2008 Data Set的数据预处理
图2.2 Diabetes 130-US Hospitals for Years 1999-2008 Data Set数据集中的空缺数据
首先检查数据文本,发现有空缺数据,且以“?”的形式显示,如图2.2所示。由于该数据集中的某些属性中存在着大量的空缺数据,所以在导入数据后需要替换空缺数据,代码如下:
unchanged = pd.read_csv(path,encoding='utf-8-sig')
unchanged.replace(regex='\?',value=np.nan,inplace=True)
之后通过观察数据发现有些实例由于丢失的数据量太大,已经失去了进行聚类的意义,故设置了阈值为0.7对数据进行清洗,即若一条实列数据的空缺值超过了30%,就跳过此条数据,代码如下:
cleaned_data = unchanged.dropna(axis=1,thresh=len(unchanged)*0.7)
由于该数据集的属性过多且一些属性空缺值太多(如weight列的空缺比例达到了97%),故在查询了相关资料后确定了六条与糖尿病相关性最大且空缺比例较低的良好属性(表3.1)作为此次数据挖掘的主要待挖掘属性,以期在减少计算量的同时保证结果的鲁棒性。
表3.1 此次数据挖掘确定的主要属性
| 属性英文名 |
属性描述 |
| Time in hospital |
Integer number of days between admission and discharge |
| Number of lab procedures |
Number of lab tests performed during the encounter |
| Number of procedures |
Number of procedures (other than lab tests) performed during the encounter |
| Number of medications |
Number of distinct generic names administered during the encounter |
| Number of diagnoses |
Number of diagnoses entered to the system |
| Number of emergency visits |
Number of emergency visits of the patient in the year preceding the encounter |
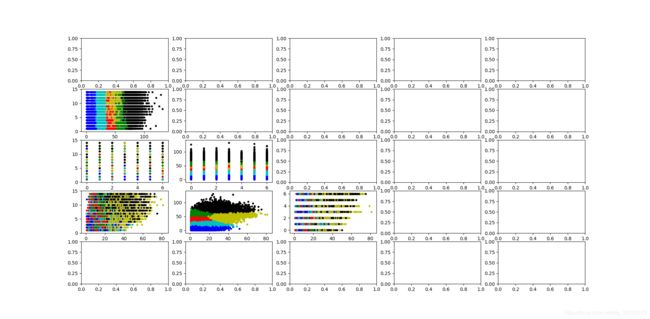
之后选择了前1000条数据对以上六条属性进行两属性的散点图绘制,结果如图2.3所示。
图2.3 Diabetes 130-US Hospitals for Years 1999-2008 Data Set前1000条实例的数据散点图
2.3 Dow Jones Index Data Set的数据预处理
首先检查数据文本,发现有数据空缺,由于空缺数据条数较少,故将空缺数据删去,并去除与之相关性较弱的“Quarter”、“Stock”与“Date”三列。之后对带有美元符号“$”的数据进行去除美元符号的处理并绘制散点图,最后结果如图2.4所示。
图2.4 Dow Jones Index Data Set实列的数据散点图
三、聚类算法
此次实验使用了三种聚类算法对三个目标数据集进行聚类操作,分别为基于划分的K-Means聚类算法、基于密度的Mean-Shift聚类算法与基于高斯混合模型(GMM)的EM聚类算法。接下来对三种算法的实现做详细的介绍。
3.1 K-Means聚类算法
K-Means算法是典型的基于划分的聚类算法,在该算法中每个簇的中心都用簇中所有对象的均值(Mean)表示。该算法的输入为簇的数目与包含n个对象的数据集,输出为k个簇的集合。具体步骤如图3.1所示。
图3.1 K-Means算法步骤
第一步为从D中任意选择k个对象作为初始簇中心。具体做法为给定一个数组,找到数组中每个坐标的最小值与最大值,框定其范围,之后在范围内随机生成k个随机点,返回范围内的随机点组成的数组,数组中的点为随机选中的初始簇的中心。代码如下:
def generate_k(data,k):
centers = []
dimensions = len(data[0])
min_max = defaultdict(int)
for point in data:
for i in range(dimensions):
val = point[i]
min_key = 'min_%d' % i
max_key = 'max_%d' % i
if min_key not in min_max or val < min_max[min_key]:
min_max[min_key] = val
if max_key not in min_max or val > min_max[max_key]:
min_max[max_key] = val
for _k in range(k):
rand_point = []
for i in range(dimensions):
min_val = min_max['min_%d' % i]
max_val = min_max['max_%d' % i]
rand_point.append(ra.uniform(min_val,max_val))
centers.append(rand_point)
return centers
第二步为根据簇中对象的均值,将每个对象分配到最相似的簇。具体做法为给定数据集与其他点之间的点列表,将每个点的索引分配为与其最接近的中心点的索引,其中确定索引归属的目标函数为平方和误差函数(sum of the squared error,SSE):
实现SSE计算的对应代码如下:
def distance(a,b):
dimensions = len(a)
_sum = 0
for dimension in range(dimensions):
difference_sq = (a[dimension] - b[dimension]) ** 2
_sum += difference_sq
return sqrt(_sum)
取令SSE最小的中心点索引值作为其点的索引值保存入返回数组中,返回数组为包含每个点索引值的数组(如图3.2)。通过这一步能够得到每个点所在的最相似簇。代码如下:
def assign_data_points(data,center):
assignments = []
for point in data:
shortest = (65536,)
shortest_index = 0
for i in range(len(center)):
val = (distance(point,center[i]),)
if val < shortest:
shortest = val
shortest_index = i
assignments.append(shortest_index)
print(assignments)
return assignments
图3.2 返回数组assignments的运行实例
第三步为更新簇均值,重新计算每个簇中对象的均值。首先需要获取更新后的中心点,代码如下:
def update_data_center(data,target_names):
new_means = co.defaultdict(list)
center = []
for target_names,point in zip(target_names,data):
new_means[target_names].append(point)
for data in new_means.values():
center.append(avg_data_center(data))
return center
获取了新的中心点之后需要再次计算每个簇中点的均值,此时应该调用函数assign_data_points()并循环迭代下去,直到assignments不再变化为止。该迭代逻辑实现为:
old_assignments = None
while assigments != old_assignments:
new_centers = update_data_center(data,assigments)
old_assignments = assigments
assigments = assign_data_points(data,new_centers)
3.2 Mean-Shift聚类算法
Mean-Shift是基于密度的聚类算法,其本质是一个迭代过程,最终能找出一组数据密度分布的极值。
首先确定Mean-Shift所需的属性。定义Mean-Shift向量,给定d维空间Rd的n个样本点 ,i=1,…,n,在空间中任选一点x,那么Mean-Shift向量的基本形式定义为:
设![]() 是一个半径为h的高维球区域,它是满足以下关系的y点的集合:
是一个半径为h的高维球区域,它是满足以下关系的y点的集合:
![]()
k为在n个点的样本![]() 中,有k个点落在
中,有k个点落在![]() 区域中。
区域中。
Mean-Shift的过程是在d维空间中任选一个点,以这个点为圆心,h为半径做一个高维球。落在这个球内的所有点和圆心都会产生一个向量,向量是以圆心为起点落在球内的点位终点。然后把这些向量都相加。相加的结果就是Mean-shift向量。该过程如图3.3所示,黄色箭头就是相加得出的Mean-shift向量。
图3.3 Mean-Shift向量
然后再以这个Mean-Shift向量的终点为圆心,继续上述过程,又可以得到一个Mean-Shift向量,如图3.4所示。重复这一过程直到向量为0或移动量低于阈值,运动停止。
图3.4 以新的Mean-Shift向量终点为圆心继续计算
将上述Mean-Shift聚类过程画为流程图,如图3.5所示。
图3.5 Mean-Shift算法步骤
第一步为确定参数的初值。其中radius为圆的半径;radius_step用于在计算簇时确定单步执行的间隔数;weights是一个仅包含数字的权重列表,在对其进行weights.reverse()操作后能够将其倒序,这样权重最高的索引便会在最前了;threshold是用于确定某个簇是否已经收敛的阈值;max_iter是防止程序陷入死循环或大数循环而设置的最大的迭代次数;final_clusters用于保存运行fit()后的簇;cluster_mapping用于保存训练的数据点到每个点最终映射的簇的值以便对数据进行可视化操作。
self.radius = radius
self.radius_step = radius_step
self.weights = [i*100 for i in range(self.radius_step)]
self.weights.reverse()
self.threshold = .0000000001
self.max_iter = 600
self.final_clusters = []
self.cluster_mapping = {}
第二步需要循环遍历现有的簇的圆心并计算其到其他点的距离,在完成所有点的计算后需要重新计算新的簇并与点至旧簇圆心的位置进行比较,观察其是否需要移动,若需要的移动量低于阈值则停止。
for _ in range(self.max_iter):
for label in clusters:
for point in data:
distance = np.linalg.norm(point - clusters[label][2])
weight_index = min(int(distance / self.radius), self.radius_step-1)
weight = self.weights[weight_index]
clusters[label][0] += weight*point
clusters[label][1] += weight
prev_clusters = dict(clusters)
clusters = {}
for label in prev_clusters:
cluster_info = prev_clusters[label]
if prev_clusters[label][1] == 0:
print("odd", prev_clusters[label])
new_cluster = np.sum(cluster_info[0], axis=0) / cluster_info[1]
old_cluster = prev_clusters[label][2]
clusters[label] = [[new_cluster], 1, new_cluster, old_cluster]
若找到的圆心太多,则需要重新运行fit(),但是理论上找到的圆心太少该函数可能不会重新运行。代码如下:
def refit(self, data, percent, new_radius=.008):
print("ran a refit because percent centroids was: {}%".format(percent*100))
print("Old radius was {} and now we are switching to {}".format(self.radius, new_radius))
self.radius = new_radius
self.cluster_mapping = {}
self.fit(data)
3.3 EM聚类算法
基于高斯混合模型(GMM)的最大期望(EM)聚类属于软分配的一种。不同于K-Means的硬分配,EM聚类给出每个样本被分配到每个簇的概率,最后从中选取一个最大的概率对应的簇作为该样本被分配到的簇。
由中心极限定理可知,当数据量很大时,同种数据的统计特性都趋于高斯分布,若要进行聚类,就可以首先假设第k类的数据服从高斯分布,其概率密度为![]() ,并有一个出现的先验概率
,并有一个出现的先验概率![]() ,而K个类别的线性叠加就组成了GMM的概率密度函数:
,而K个类别的线性叠加就组成了GMM的概率密度函数:
其中![]() 为先验概率,
为先验概率,![]() 为似然函数的均值,
为似然函数的均值,![]() 为方差。在上述参数已知的情况下,可求得每一个样本
为方差。在上述参数已知的情况下,可求得每一个样本![]() 属于某个类别k的概率。当前样本出现的联合概率密度为:
属于某个类别k的概率。当前样本出现的联合概率密度为:
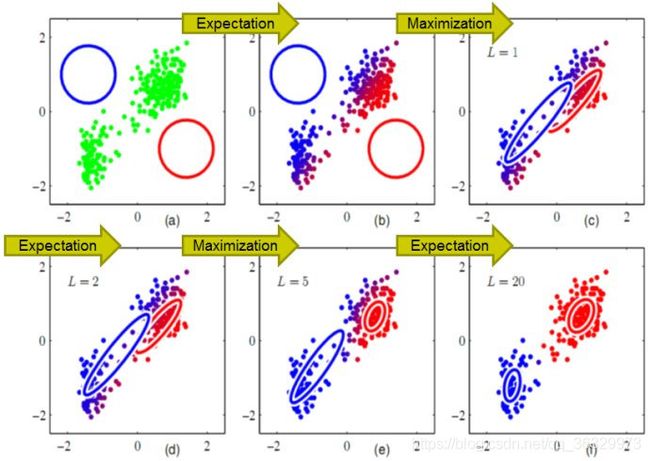
之后采用EM这种迭代优化的方法求得较为理想的簇。EM算法包括两步:
1、Expectation:对每类都任意假设一组参数(![]() ,
,![]() ,
,![]() ),并假设每个数据都存在相应的 “隐变量”(即每个数据各自的类别)
),并假设每个数据都存在相应的 “隐变量”(即每个数据各自的类别)![]() ,然而隐变量的真值是未知的,所以就可根据当前观测值以及假设的参数,用隐变量的条件期望
,然而隐变量的真值是未知的,所以就可根据当前观测值以及假设的参数,用隐变量的条件期望![]() 来代替隐变量
来代替隐变量![]() 并求得其值。
并求得其值。
2、Maximization:将得到的隐变量![]() 看作正确的划分,结合当前数据,用最大似然的方法估计参数
看作正确的划分,结合当前数据,用最大似然的方法估计参数![]() ,
,![]() ,
,![]() 。
。
EM聚类算法的聚类过程如图3.6所示。
图3.6 EM聚类算法的聚类过程
将上述EM聚类算法画为流程图,如图3.7所示。
图3.7 EM算法步骤
第一步是对数据进行再处理,将数据缩放到0-1之间,代码如下:
def scale_data(Y):
for i in range(Y.shape[1]):
max_ = Y[:, i].max()
min_ = Y[:, i].min()
Y[:, i] = (Y[:, i] - min_) / (max_ - min_)
return Y
第二步为初始化点(模型)的参数。在需要输入的参数中,shape(N,D)是表示样本规模的二元组,其内容为(样本数,特征数);K为模型的个数。输出参数中的mu为均值多维数组,每行表示一个样本各个特征的均值;cov为协方差矩阵的数组;alpha为模型响应度数组。代码如下:
def init_params(shape, K):
N, D = shape
mu = np.random.rand(K, D)
cov = np.array([np.eye(D)] * K)
alpha = np.array([1.0 / K] * K)
return mu, cov, alpha
第三步为EM算法中的E步,用以计算每个点对样本的响应度。需要输入的参数除了mu、cov与alpha外还有样本矩阵Y。该步算法流程如图3.8所示,首先获取样本数与模型数,样本数与模型数均需大于1以避免返回结果的不一致。之后需要通过样本数与模型数初始化全为0的响应度矩阵gamma,在计算过个模型所有样本出现的概率(利用scipy.stats中的multivariate_normal进行计算)后计算每个样本的响应度并填入响应度矩阵中。
图3.8 EM算法中的E步计算过程
def getExpectation(Y, mu, cov, alpha):
N = Y.shape[0]
K = alpha.shape[0]
assert N > 1, "There must be more than one sample!"
assert K > 1, "There must be more than one gaussian model!"
gamma = np.mat(np.zeros((N, K)))
prob = np.zeros((N, K))
for k in range(K):
prob[:, k] = phi(Y, mu[k], cov[k])
prob = np.mat(prob)
for k in range(K):
gamma[:, k] = alpha[k] * prob[:, k]
for i in range(N):
gamma[i, :] /= np.sum(gamma[i, :])
return gamma
第四步为EM算法中的M步,输入样本矩阵Y与响应度矩阵gamma后更新每个点的参数,返回更新后的mu、cov与alpha。代码如下:
def maximize(Y, gamma):
N, D = Y.shape
K = gamma.shape[1]
mu = np.zeros((K, D))
cov = []
alpha = np.zeros(K)
for k in range(K):
Nk = np.sum(gamma[:, k])
mu[k, :] = np.sum(np.multiply(Y, gamma[:, k]), axis=0) / Nk
cov_k = (Y - mu[k]).T * np.multiply((Y - mu[k]), gamma[:, k]) / Nk
cov.append(cov_k)
alpha[k] = Nk / N
cov = np.array(cov)
return mu, cov, alpha
四、模型测试
本次实验利用“Seeds Data Set”,“Diabetes 130-US Hospitals for Years 1999-2008 Data Set”与“Dow Jones Index Data Set”三个数据集对基于划分的K-Means聚类算法、基于密度的Mean-Shift聚类算法与基于高斯混合模型(GMM)的EM聚类算法分别进行了测试,具体测试结果将在接下几节进行总结。
4.1 Seeds Data Set的测试结果
4.1.1 Seeds Data Set数据集的K-Means聚类测试
对Seeds Data Set数据集进行K-Means聚类测试,将每两个属性作为一组进行绘图,令k=3进行测试后结果如图4.1所示。
图4.1 Seeds Data Set数据集的K-Means聚类结果
由于其左上与右下两部分数据重复,为了减少计算量在接下来绘图的过程中皆将结果总图绘制成图4.2的模式。
图4.2 精简后的Seeds Data Set数据集的K-Means聚类结果
记录下其多次运行后的结果并计算其准确率,结果如表4.1所示。从表中可以发现在前四次运行时准确率基本稳定在89%左右,但是第五次测试时出现了异常情况。
表4.1 K-Means准确率统计
| 第一类 |
第二类 |
第三类 |
准确率 |
|
| 第一次 |
68 |
81 |
61 |
89.52% |
| 第二次 |
67 |
82 |
61 |
88.57% |
| 第三次 |
72 |
77 |
61 |
91.42% |
| 第四次 |
67 |
82 |
61 |
88.57% |
| 第五次 |
128 |
82 |
0 |
33.34% |
| 平均准确率 |
78.28% |
第五次测试出的结果图如图4.3所示。该错误聚类体现出了K-Means算法的缺陷,即k个初始点中心点的取值会影响K-Means的结果,最后生成的结果往往很大程度上取决于一开始k个中心点的位置,在中心点选取不理想的情况下容易陷入局部最优解。因此对中心点需要不断进行调整,但是在数据量非常大时这一过程的工作量是相当大的。
 图4.3 错误的Seeds Data Set数据集的K-Means聚类结果
4.1.2 Seeds Data Set数据集的Mean-Shift聚类测试
对Seeds Data Set数据集进行Mean-Shift聚类测试,在K-Means获得数据的基础上选取合适的列进行测试。由于Mean-Shift聚类需要调整各类参数,所以需要设置不同参数多次进行测试。
首先取r=0.006情况下对应K-Means结果第一列的聚类情况,聚类结果如图4.4所示。从图中可以看出当r=0.06时对不同的数据会聚为数量不等的簇。原因是Mean-Shift为基于密度的聚类,聚成簇的数量是算法自行确定的。
图4.4 r=0.006情况下的Mean-Shift聚类情况
之后固定数据并改变r的取值,观察聚类的变化。取第1与第6个数据进行聚类并绘图,其中取r值分别为r=0.05、r=0.01、r=0.009、r=0.006、r=0.005。结果如图4.5所示。能够看出随着r值的减小,获得簇的数量越来越多。当r=0.05时只能聚为一类,而r=0.005时聚为了六类。所以对于基于密度的聚类算法来说,初始值的设定左右着最终得出的聚类结果。
图4.5 取不同r值情况下的Mean-Shift聚类情况
4.1.3 Seeds Data Set数据集的EM聚类测试
对Seeds Data Set数据集进行EM聚类测试,将每两个属性作为一组进行绘图,令k=3进行测试后结果如图4.6所示。
图4.6 Seeds Data Set数据集的EM聚类结果
在执行多次EM算法后获得在不同数据中EM聚类算法的准确率,如表4.2所示。在大部分情况下EM聚类的准确率略高于K-Means聚类,但是也会出现如第四次出现的低准确率的问题。且EM算法计算时间相较于K-Means算法更多,收敛较慢,不适合大规模数据集及高维数据集,但是结果比K-Means更稳定些。
表4.2 EM准确率统计
| 第一类 |
第二类 |
第三类 |
准确率 |
|
| 第一次 |
47 |
64 |
99 |
86.19% |
| 第二次 |
79 |
77 |
54 |
92.38% |
| 第三次 |
67 |
67 |
76 |
97.14% |
| 第四次 |
116 |
78 |
16 |
74.28% |
| 第五次 |
57 |
81 |
72 |
93.81% |
| 第六次 |
74 |
79 |
57 |
93.81% |
| 第七次 |
87 |
53 |
70 |
91.90% |
| 第八次 |
63 |
54 |
93 |
89.04% |
| 第九次 |
65 |
47 |
98 |
86.67% |
| 第十次 |
82 |
79 |
49 |
90.00% |
| 平均准确率 |
89.52% |
4.2 Diabetes 130-US Hospitals for Years 1999-2008 Data Set的测试结果
首先对10万条数据进行特定行、列组合的K-Means聚类(K=6)。结果如图4.7所示。之后再提取5000条数据、500条数据分别进行K-Means聚类,结果如图4.8与图4.9所示。通过对比我们可与发现取数据集中的500至5000条数据与10万条数据的聚类结果大体一致,故在接下来的聚类操作中可适当减少聚类总数以减少计算量。
图4.7 10万条数据的K-Means聚类
图4.8 5000条数据的K-Means聚类
图4.9 500条数据的K-Means聚类
从图中可看出第二个参数与第四个参数所构成的散点图能够被很好的聚类,故在Mean-Shift与EM算法中使用该组作为主要聚类对象。当Mean-Shift取r=0.05时获得的图如图4.10所示,当取r=0.03时获得的图如图4.11所示。
图4.10 1000条数据的、r=0.05的Mean-Shift聚类
图4.11 1000条数据的、r=0.03的Mean-Shift聚类
4.3 Dow Jones Index Data Set的测试结果
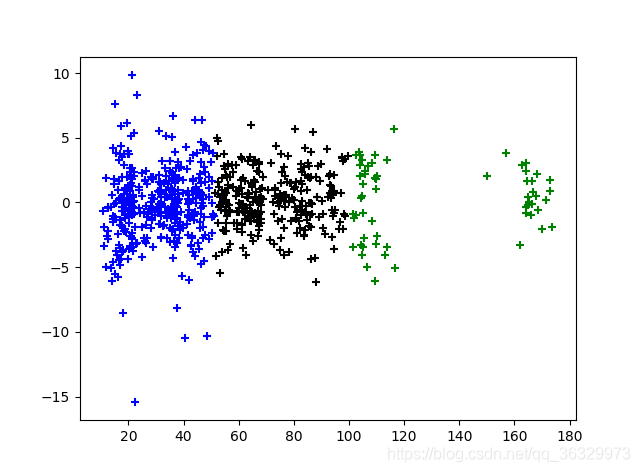
该数据集的三种聚类方式所得结果分别如图4.12、图4.13、图4.14所示,其中K-Means聚类算法与Mean-Shift聚类算法使用了特征较为明显的两类进行聚类,EM聚类算法使用了所有类型交叉组合进行聚类。
图4.12 Dow Jones Index Data Set数据集的K-Means聚类结果
图4.13 Dow Jones Index Data Set数据集的Mean-Shift聚类结果
图4.14 Dow Jones Index Data Set数据集的EM聚类结果
-
总结
通过此次实验实践了三种较为简单的数据挖掘算法,深刻理解了所实验算法的优劣。其中K-Means算法的优点为简单高效且当簇接近高斯分布时效果较好,缺点是k值再现实聚类时大多难以估计,且初始的中心点对聚类结果影响很大;Mean-Shift算法时基于密度的聚类算法,无法给定k值,会导致簇的数量不好控制,另外算法收敛的速度很大程度上与选取圆的r有关;EM算法的思路是在概率模型中寻找参数的最大似然估计,收敛速度较慢但稳定性较K-Means来说更好。
此次实验让我对数据挖掘的常用算法有了一定的掌握,对数据挖掘的思路有了初步的认识,对以后的科研生活有积极的推进作用。


