机器学习—聚类(Clustering)
K均值算法(K-means algorithm)
- 用μ1,μ2,…,μk 来表示聚类中心
- 用c(i)(i=1,…m)来存储与第 i 个样本数据x(i)最近的聚类中心的索引

- 先随机初始化聚类中心
- 算法的两个重要循环:
- 第一个for循环,计算每个样本数据x(i)距离哪一个聚类中心近,即:对于每个样本数据x(i) ,计算其应该属于的聚类中心
- 第二个for循环,是聚类中心的移动,即:对于每一个聚类中心,重新计算它的中心
K均值算法优化目标
![]() 目前被分配的聚类中心的样本
目前被分配的聚类中心的样本 ![]() 指数 (1,2,…, )
指数 (1,2,…, )
![]() 聚类中心 (
聚类中心 (![]() )
)
![]() 已经被分配聚类中心的样本
已经被分配聚类中心的样本 ![]()
K均值算法应用于未分开的聚类
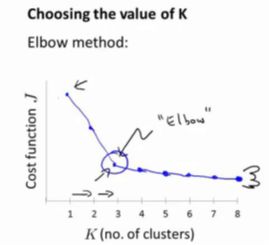
选择聚类数:“肘部法则”
- 关于“肘部法则”,所需要做的是改变K值,也就是聚类类别数目的总数。用一个聚类来运行K均值聚类方法。这就意味着,所有的数据都会分到一个聚类里,然后计算成本函数J。
- K代表聚类数目
- 在k=3时,图形达到了一个最优的最小值。即使within-cluster的距离在3之后减少,我们还需要做更多的计算。这与收益递减律类似。因此,我们选择一个3作为最优。

K-Means主要有两个最重大的缺陷
- K 是事先给定的,这个 K 值的选定是非常难以估计的。很多时候,事先并不知道给定的数据集应该分成多少个类别才最合适。
- K-Means算法需要随机初始种子点,这个随机种子点太重要,不同的随机种子点会有得到完全不同的结果。
聚类算法python实现思路
- 数据预处理
(初始化、缩放) - K均值算法
1)距离函数
2)聚类中心初始化
3)Kmean计算 - 计算并展示结果
聚类算法python库实现:
import numpy as np     # 导入numpy库
import matplotlib.pyplot as plt      # 导入matplotlib.pylab库
from sklearn.cluster import KMeans    # 导入sklearn.cluster库
estimator = KMeans(n_clusters=4)
主要参数:
n_clusters : 隐聚类中心数目, 缺省为8
init : 初始化方法 {‘k-means++’, ‘random‘, ndarray}, 缺省’k-means++’ (智能选择聚类中心)
n_init : k-means算法在以不同的聚类中心组合运行的次数,缺省10
max_iter : k-means算法每次运行时,最大迭代次数,缺省300
tol : 容忍度, 可选, 没两次代价的差值达到10-4就停止了。缺省le-4, 达到此值即停止
precompute_distances : 提前计算距离{‘auto’, True, False} ‘auto’: 若n_samples * n_clusters > 12 million 不进行
random_state: 缺省None; 若int, 随机数产生器seed, 若RandomStates实例, 随机数产生器, 若None, np.random
缺点:结果高度依赖于初始值的设置
estimate.predict(X)    #预测数据集X中每个样本所属的聚类中心索引
estimate.fit_predict(X)   #计算聚类并预测每个样本的中心:[索引1, 索引2…]
estimate.transform(X)   #将样本数据集X转换到(聚类-距离)空间shape(m,k)
estimate.fit_transform(X)  # 计算聚类并将X转换到(聚类-距离)空间: shape(m,k)
estimate.cluster_centers_    #聚类中心坐标: shape(k, n_features)
estimate.labels_   #每个样本的所属中心标签索引,同predict(X),shape(m,)
estimate.inertia_    # 所有样本与其最近中心距离的平方和
estimate.score(X)    # k-mean算法目标值的相反值, 即inertia_相反值
计算并展示结果(分类结果)
def showCluster(X, k, centroids, clusterAssment):
    m, dim = X.shape       #样本数m,维度dim
# 画所有样本
    mark = [‘or’, ‘ob’, ‘og’, ‘ok’, ‘^r’, ‘+r’, ‘sr’, ‘dr’, ‘
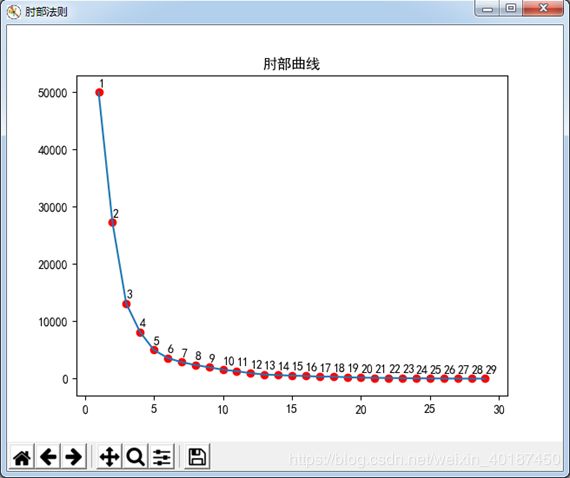
计算并展示结果(肘部法则曲线)
#画肘部法则曲线
k=[]
inertia=[]
for i in range(data.shape[0]-1):
    estimator = KMeans(n_clusters=i+1)
    res = estimator.fit_predict(data)
    k.append(i+1)
    inertia.append(estimator.inertia_); #print(int(inertia))

plt.figure('肘部法则')
plt.title('肘部曲线')
plt.plot(k,inertia)
plt.scatter(k,inertia,c='r')
#画标注
for i in range(data.shape[0]-1):
    plt.annotate(str(k[i]), xy=(k[i], inertia[i]), xytext=(+0, +4),
             textcoords='offset points', fontsize=10)
plt.show()


