python_数据_roc_auc
auc roc
start
import numpy as np
import pandas as pd
import matplotlib.pyplot as plt

from sklearn import datasets

from sklearn.metrics import auc
from sklearn.metrics import roc_curve
from sklearn.metrics import confusion_matrix
from sklearn.metrics import classification_report

from sklearn.model_selection import StratifiedKFold
from sklearn.model_selection import train_test_split

from sklearn.svm import SVC
from sklearn.linear_model import LogisticRegression
假设有一组数据,prob(特征)与y(分类)具有关系
使用不同的阈值(threshold),通过阈值对prob进行划分
y = np.array([1,1,1,1,1,1,0,0,0,1,1,0,0,1,1,0,0,1,1,0,0])
prob = np.array([0.42,0.73,0.55,0.37,0.57,0.70,0.25,0.23,0.46,0.62,0.76,0.46,0.55,0.56,0.56,0.38,0.37,0.73,0.77,0.21,0.39])

thresholds = np.linspace(0,1,11)
for threshold in thresholds:
    y_ = (prob >= threshold).astype(np.int8)
    print(threshold.astype(np.float16),end='\t')
    print((y_ == y).mean().astype(np.float16))
- out: 0.0 0.5713
0.1 0.5713
0.2 0.5713
0.3 0.7144
0.4 0.8096
0.5 0.857
0.6 0.7144
0.7 0.619
0.8 0.4285
0.9 0.4285
1.0 0.4285 - 此时,当阈值为0.5时,准确率最高
选取的阈值为0.4时,观察交叉表
y_ = (prob >= 0.4).astype(np.int8)

cm = pd.crosstab(y_,y,rownames=['预测'],colnames=['真实'])
cm
- out:
| 预测 \真实 | 0 | 1 |
|---|---|---|
| 0 | 6 | 1 |
| 1 | 3 | 11 |
# 交叉表的数据
cm = confusion_matrix(y_,y,)
cm[0,0],cm
- out: (6, array([[ 6, 1],
[ 3, 11]], dtype=int64))
绘制roc曲线与洛伦兹曲线
tprs = []
fprs = []
for threshold in thresholds:
    # 给了阈值,概率变成了类别
    y_ = (prob >= threshold).astype(np.int8)
    cm = confusion_matrix(y_,y)

    tpr = cm[1,1]/(cm[0,1] + cm[1,1])   # 召回率 越大越好
    fpr = cm[1,0]/(cm[0,0] + cm[1,0])   # 越小越好

    tprs.append(tpr)
    fprs.append(fpr)

plt.plot(fprs,tprs)  # x轴为fprs,y轴为召回率tprs;曲线右下方空间越大越好
auc(fprs,tprs)   # 比准确率更有说服性   0.9212962962962963

y_1 = np.array(tprs) - np.array(fprs)   # 作为y轴
x_1 = np.linspace(0,1,11)   # 作为x轴
# ??画在同一图中,坐标意义不同
plt.plot(x_1,y_1)    # 洛伦兹曲线   # 正负样本分离度
使用datasets中的酒数据,使用svm(支持向量机)和逻辑斯蒂两种方式对比分类
对分类结果进行列表展示
wine = datasets.load_wine()
X = wine['data']
y = wine['target']

wine   # 略
wine.target_names  # 三分类问题
- out: array([‘class_0’, ‘class_1’, ‘class_2’], dtype=’
svc = SVC(kernel='poly',degree=3,gamma='auto')

X_train,X_test,y_train,y_test = train_test_split(X,y,random_state = 2)
svc.fit(X_train,y_train)
y_ = svc.predict(X_test)

print(classification_report(y_test,y_,labels=[0,1,2]))
print(svc.score(X_test,y_test))
-
out:
-
precision recall f1-score support 0 1.00 1.00 1.00 19 1 0.93 1.00 0.96 13 2 1.00 0.92 0.96 13 micro avg 0.98 0.98 0.98 45 macro avg 0.98 0.97 0.97 45 weighted avg 0.98 0.98 0.98 45 -
0.9777777777777777
logis = LogisticRegression()

X_train,X_test,y_train,y_test = train_test_split(X,y,random_state = 2)
logis.fit(X_train,y_train)
y_ = logis.predict(X_test)

print(classification_report(y_test,y_,labels=[0,1,2]))
print(logis.score(X_test,y_test))
-
out :
-
precision recall f1-score support 0 1.00 0.89 0.94 19 1 0.81 1.00 0.90 13 2 1.00 0.92 0.96 13 micro avg 0.93 0.93 0.93 45 macro avg 0.94 0.94 0.93 45 weighted avg 0.95 0.93 0.94 45 -
0.9333333333333333
支持向量机和逻辑斯蒂都更倾向于二分类
样本不均衡或二分类时,更要用auc
抽取酒数据的的两类作为数据,绘制auc曲线
cond = (y != 2)
X = X[cond]
y = y[cond]
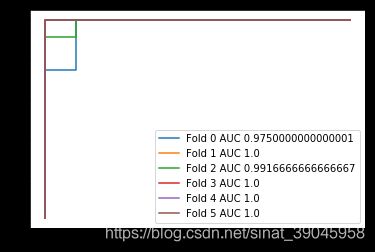
model = SVC(probability=True,gamma='auto',kernel='poly')

# 六折交叉验证
sKFold = StratifiedKFold(n_splits=6)

i = 0
for train,test in sKFold.split(X,y):
    X_train,X_test = X[train],X[test]
    y_train,y_test = y[train],y[test]

    model.fit(X_train,y_train)

    proba_ = model.predict_proba(X_test)

    y_ = proba_[:,1]  # y_为预测其为正样本(1)的概率

#     fpr,tpr,thresholds = roc_curve(y_test,y_,drop_intermediate=False)

    fpr,tpr,thresholds = roc_curve(y_test,y_)

    auc_ = auc(fpr,tpr)

    plt.plot(fpr,tpr,label = 'Fold {} AUC {}'.format(i,auc_))

    i+=1
plt.legend()
model = LogisticRegression(solver='liblinear')

sKFold = StratifiedKFold(n_splits=6)

i = 0
for train,test in sKFold.split(X,y):
    X_train,X_test = X[train],X[test]
    y_train,y_test = y[train],y[test]

    model.fit(X_train,y_train)

    proba_ = model.predict_proba(X_test)

    y_ = proba_[:,1]

    fpr,tpr,thresholds = roc_curve(y_test,y_)

    auc_ = auc(fpr,tpr)     # 可以用平均auc

    plt.plot(fpr,tpr,label = 'Fold {} AUC {}'.format(i,auc_))

    i+=1
plt.legend()
-
fpr,tpr,thresholds = roc_curve(y_test,y_)
参数
y_true : array, shape = [n_samples]
True binary labels. If labels are not either {-1, 1} or {0, 1}, then
pos_label should be explicitly given.y_testy_score : array, shape = [n_samples]
Target scores, can either be probability estimates of the positive
class, confidence values, or non-thresholded measure of decisions
(as returned by “decision_function” on some classifiers).
pos_label : int or str, default=None
Label considered as positive and others are considered negative.y_ -----> probability estimates of the positive classdrop_intermediate : boolean, optional (default=True)
Whether to drop some suboptimal thresholds which would not appear
on a plotted ROC curve. This is useful in order to create lighter
ROC curves.返回值
fpr : array, shape = [>2]
Increasing false positive rates such that element i is the false
positive rate of predictions with score >= thresholds[i].tpr : array, shape = [>2]
Increasing true positive rates such that element i is the true
positive rate of predictions with score >= thresholds[i].thresholds : array, shape = [n_thresholds]
Decreasing thresholds on the decision function used to compute
fpr and tpr.thresholds[0]represents no instances being predicted
and is arbitrarily set tomax(y_score) + 1.


