Python 项目二 数据可视化
一、生成数据
1.安装matplotlib
用的pycharm编译器 直接在pycharm中安装即可
file-settings-project interpreter+matplotlib
2.绘制简单折线图
import matplotlib.pyplot as plt
input_values=[1,2,3,4,5]
squares = [1,4,9,16,25]
plt.plot(input_values,squares,linewidth=5)
#设置图标标题 并给坐标轴加上标签
plt.title("Square number",fontsize =24)
plt.xlabel("Value",fontsize=14)
plt.ylabel("Square of Value",fontsize=14)
#设置刻度的大小
plt.tick_params(axis="both",labelsize=14)
plt.show()
import matplotlib.pyplot as plt
x_values=list(range(1,1001))
y_values=[x**2 for x in x_values]
#plt.scatter(x_values,y_values,edgecolor ="none",c=(0,0,0.2),s=40)
#s设置点的尺寸,c设置线条颜色"red"或者RGB模式,制定原则(0,0,0.2)颜色越接近0越深。默认蓝色的 点和黑色的轮廓,需要删除黑色的轮廓
plt.scatter(x_values,y_values,edgecolor ="none",c=y_values,cmap=plt.cm.Blues,s=40)
plt.title("Square number",fontsize =24)
plt.xlabel("Value",fontsize=14)
plt.ylabel("Square of Value",fontsize=14)
#设置刻度标记大小
#plt.tick_params(axis="both",which="major",labelsize=14)
#设置每个坐标轴的取值范围
plt.axis([0,1100,1,1100000])

#plt.show()
plt.savefig("squares_plot.png",bbox_inches="tight")
创建RandomWalk 类
from random import choice
class RandomWalk():
    '''一个生成随机漫步数据的类'''
    def __init__(self,num_points=5000):
        '''初始化随机漫步的属性'''
        self.num_points=num_points

        #所有随机漫步数据都开始于0,0
        self.x_values=[0]
        self.y_values=[0]
    def fill_walk(self):
        '''计算随机漫步包含的所有点'''

        #不断漫步,直到列表到达指定长度
        while len(self.x_values)
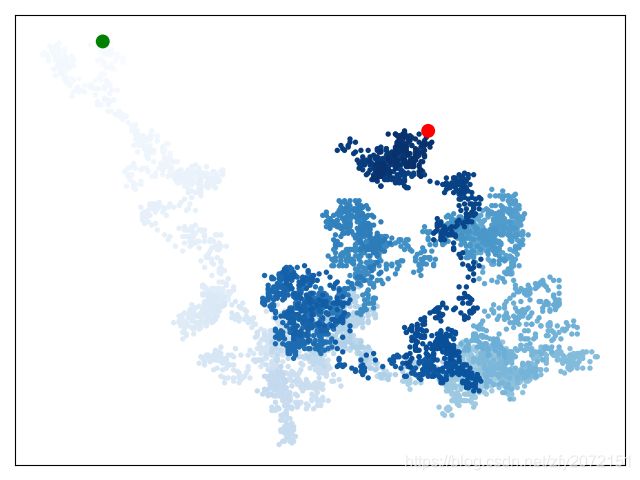
画图 随机漫步并设置样式
from random_walk import RandomWalk
import matplotlib.pyplot as plt

while True:

    # 创建一个randomwalk实例,并绘制出图形
    rw = RandomWalk(5000)
    rw.fill_walk()
    point_numbers = list(range(rw.num_points))
    plt.scatter(rw.x_values, rw.y_values,c=point_numbers,
                cmap =plt.cm.Blues,edgecolor="none",s=15)#使用颜色映射来指出漫步中个点的先后顺序
     #突出起点和终点
    plt.scatter(0,0,c="green",edgecolors="none",s=100)
    plt.scatter(rw.x_values[-1],rw.y_values[-1],c="red",edgecolors ="none",
                s=100)
     #隐藏坐标轴
    plt.axes().get_xaxis().set_visible(False)
    plt.axes().get_yaxis().set_visible(False)

    #设置绘图串口的尺寸
    plt.figure(dpi =128,figsize =(10,6)) #函数figure()用于指定图标的宽 高 分辨率和背景颜色。
    plt.show()

    keep_running =input("make another walk?()y/n: ")
    if keep_running == "n":
        break


