简书地址


import torch
from torch.autograd import Variable
from torch import nn
from torch.nn import init
import torch.utils.data as Data
import torch.nn.functional as F
import matplotlib.pyplot as plt
import numpy as np
torch.manual_seed(1)
np.random.seed(1)
N_SAMPLES = 2000
BATCH_SIZE = 64
EPOCH = 12
LR = 0.03
N_HIDDEN = 8
ACTIVATION = F.tanh
B_INIT = -0.2
x = np.linspace(-7, 10, N_SAMPLES)[:, np.newaxis]
noise = np.random.normal(0, 2, x.shape)
y = np.square(x) - 5 + noise
test_x = np.linspace(-7, 10, 200)[:, np.newaxis]
noise = np.random.normal(0, 2, test_x.shape)
test_y = np.square(test_x) - 5 + noise
train_x = torch.from_numpy(x).float()
train_y = torch.from_numpy(y).float()
test_x = Variable(
torch.from_numpy(test_x).float(),
volatile = True,
)
test_y = Variable(
torch.from_numpy(test_y).float(),
volatile = True,
)
train_dataset = Data.TensorDataset(
data_tensor = train_x,
target_tensor = train_y,
)
train_loader = Data.DataLoader(
dataset = train_dataset,
batch_size = BATCH_SIZE,
shuffle = True,
num_workers = 2,
)
class Net(nn.Module):
def __init__(self, batch_normalization=False):
super(Net, self).__init__()
self.do_bn = batch_normalization
self.fcs = []
self.bns = []
self.bn_input = nn.BatchNorm1d(1, momentum=0.5)
for i in range(N_HIDDEN):
input_size = 1 if i == 0 else 10
fc = nn.Linear(input_size, 10)
setattr(self, 'fc%i' % i, fc)
self._set_init(fc)
self.fcs.append(fc)
if self.do_bn:
bn = nn.BatchNorm1d(10, momentum=0.5)
setattr(self, 'bn%i' % i, bn)
self.bns.append(bn)
self.predict = nn.Linear(10, 1)
self._set_init(self.predict)
def _set_init(self, layer):
init.normal(layer.weight, mean=0.,std=.1)
init.constant(layer.bias, B_INIT)
def forward(self, x):
pre_activation = [x]
if self.do_bn: x = self.bn_input(x)
layer_input = [x]
for i in range(N_HIDDEN):
x = self.fcs[i](x)
pre_activation.append(x)
if self.do_bn: x = self.bns[i](x)
x = ACTIVATION(x)
layer_input.append(x)
out = self.predict(x)
return out, layer_input, pre_activation
nets = [Net(batch_normalization=False), Net(batch_normalization=True)]
print(*nets)
opts = [torch.optim.Adam(net.parameters(), lr=LR) for net in nets]
loss_func = torch.nn.MSELoss()
f, axs = plt.subplots(4, N_HIDDEN+1, figsize=(10, 5))
plt.ion()
plt.show()
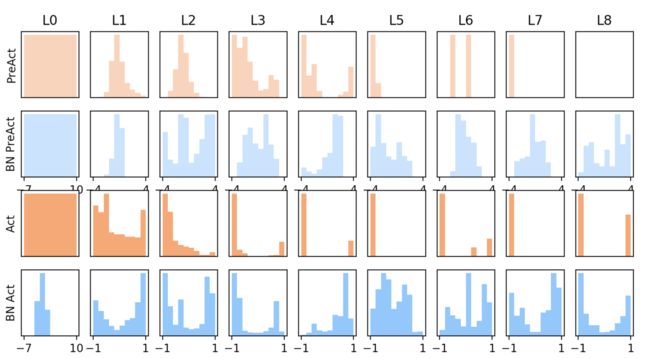
def plot_histogram(l_in, l_in_bn, pre_ac, pre_ac_bn):
for i, (ax_pa, ax_pa_bn, ax, ax_bn) in enumerate(zip(axs[0, :], axs[1, :], axs[2, :], axs[3, :])):
[a.clear() for a in [ax_pa, ax_pa_bn, ax, ax_bn]]
if i == 0: p_range = (-7, 10);the_range = (-7, 10)
else:p_range = (-4, 4);the_range = (-1, 1)
ax_pa.set_title('L' + str(i))
ax_pa.hist(pre_ac[i].data.numpy().ravel(), bins=10, range=p_range, color='#FF9359', alpha=0.5);ax_pa_bn.hist(pre_ac_bn[i].data.numpy().ravel(), bins=10, range=p_range, color='#74BCFF', alpha=0.5)
ax.hist(l_in[i].data.numpy().ravel(), bins=10, range=the_range, color='#FF9359');ax_bn.hist(l_in_bn[i].data.numpy().ravel(), bins=10, range=the_range, color='#74BCFF')
for a in [ax_pa, ax, ax_pa_bn, ax_bn]: a.set_yticks(());a.set_xticks(())
ax_pa_bn.set_xticks(p_range);ax_bn.set_xticks(the_range)
axs[0, 0].set_ylabel('PreAct');axs[1, 0].set_ylabel('BN PreAct');axs[2, 0].set_ylabel('Act');axs[3, 0].set_ylabel('BN Act')
plt.pause(0.01)
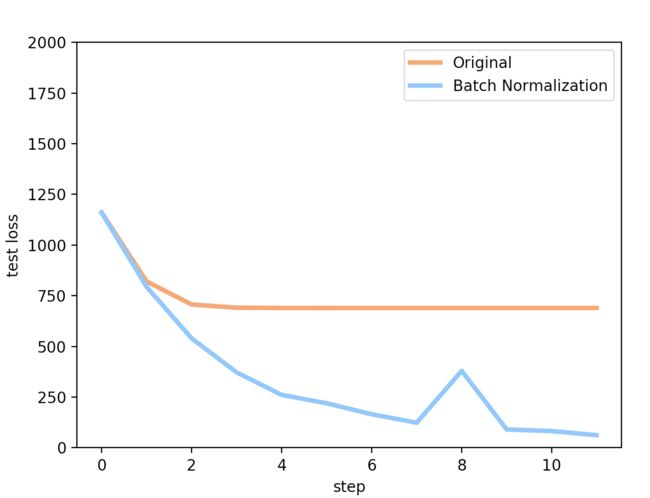
losses = [[], []]
for epoch in range(EPOCH):
print('Epoch: ',epoch)
layer_inputs, pre_acts = [], []
for net, l in zip(nets, losses):
net.eval()
pred, layer_input, pre_act = net(test_x)
l.append(loss_func(pred, test_y).data[0])
layer_inputs.append(layer_input)
pre_acts.append(pre_act)
net.train()
plot_histogram(*layer_inputs, *pre_acts)
for step, (b_x, b_y) in enumerate(train_loader):
b_x, b_y = Variable(b_x), Variable(b_y)
for net, opt in zip(nets, opts):
pred, _, _ = net(b_x)
loss = loss_func(pred, b_y)
opt.zero_grad()
loss.backward()
opt.step()
plt.ioff()
plt.figure(2)
plt.plot(losses[0], c='#FF9359', lw=3, label='Original')
plt.plot(losses[1], c='#74BCFF', lw=3, label='Batch Normalization')
plt.xlabel('step');plt.ylabel('test loss');plt.ylim((0, 2000));plt.legend(loc='best')
[net.eval() for net in nets]
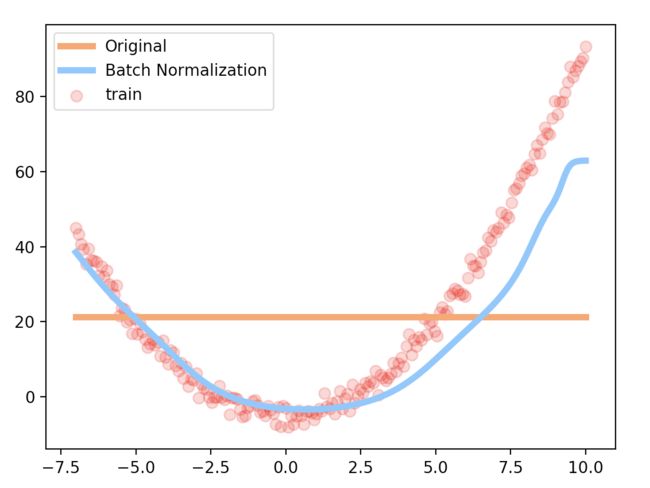
preds = [net(test_x)[0] for net in nets]
plt.figure(3)
plt.plot(test_x.data.numpy(), preds[0].data.numpy(), c='#FF9359', lw=4, label='Original')
plt.plot(test_x.data.numpy(), preds[1].data.numpy(), c='#74BCFF', lw=4, label='Batch Normalization')
plt.scatter(test_x.data.numpy(), test_y.data.numpy(), c='r', s=50, alpha=0.2, label='train')
plt.legend(loc='best')
plt.show()


