解决方案
- pycallgraph(感觉直接用pycallgraph grahviz命令生成的图并不是我想要的)
- 如何去阅读并学习一些优秀的开源框架的源码? - mailto1587的回答 - 知乎
https://www.zhihu.com/question/26766601/answer/33952627
- traceback(没有图,直接在控制台打印)
解决方案2(用django来示范)
# django里的一个view
# views.py

class ArticleSearchView(View):

    def get(self, request):
        form = SearchForm(request.GET)
        from .utils import cheese    # 在这里插入
        cheese()    # 在这里插入
        if form.is_valid():
            keyword = form.cleaned_data.get("keyword")
            if keyword:
                article_list = Article.objects.filter(title__icontains=keyword)
                return render(request, 'blog/search.html', {'form': form, 'article_list': article_list})
        else:
            form = SearchForm()
        return render(request, 'blog/search.html', {'form': form, 'article_list': False, })
# utils.py
from __future__ import unicode_literals

def cheese(frame=None, slient=False):
    import sys
    import tempfile
    import webbrowser
    import pygraphviz as pgv

    if not frame:
        frame = sys._getframe().f_back

    G = pgv.AGraph(strict=False, directed=True)

    stack = []

    node_set = set()
    subgraph_set = {}

    while frame:
        filename = frame.f_code.co_filename
        firstlineno = frame.f_code.co_firstlineno
        function = frame.f_code.co_name

        node = '{0}:{1}:{2}'.format(filename, firstlineno, function)
        if node not in node_set:
            node_set.add(node)
            if filename not in subgraph_set:
                subgraph_set[filename] = G.add_subgraph(
                    name='cluster' + filename,
                    label=filename
                )
            subgraph = subgraph_set[filename]
            subgraph.add_node(
                node,
                label='{0}:{1}'.format(firstlineno, function)
            )

        stack.append(frame)
        frame = frame.f_back

    stack.reverse()

    len_stack = len(stack)

    for index, start in enumerate(stack):

        if index + 1 < len_stack:
            start_filename = start.f_code.co_filename
            start_firstlineno = start.f_code.co_firstlineno
            start_function = start.f_code.co_name
            start_lineno = start.f_lineno
            start_subgraph = subgraph_set[start_filename]

            end = stack[index + 1]
            end_filename = end.f_code.co_filename
            end_firstlineno = end.f_code.co_firstlineno
            end_function = end.f_code.co_name
            end_subgraph = subgraph_set[end_filename]

            if index == 0:
                color = 'green'
            elif index == len_stack - 2:
                color = 'red'
            else:
                color = 'black'

            G.add_edge(
                '{0}:{1}:{2}'.format(start_filename,
                                     start_firstlineno,
                                     start_function),
                '{0}:{1}:{2}'.format(end_filename,
                                     end_firstlineno,
                                     end_function),
                color=color,
                ltail=start_subgraph.name,
                lhead=end_subgraph.name,
                label='#{0} at {1}'.format(index + 1, start_lineno)
            )

    fd, name = tempfile.mkstemp('.png')

    G.draw(name, prog='dot')
    G.close()

    if not slient:
        webbrowser.open('file://' + name)

    return name
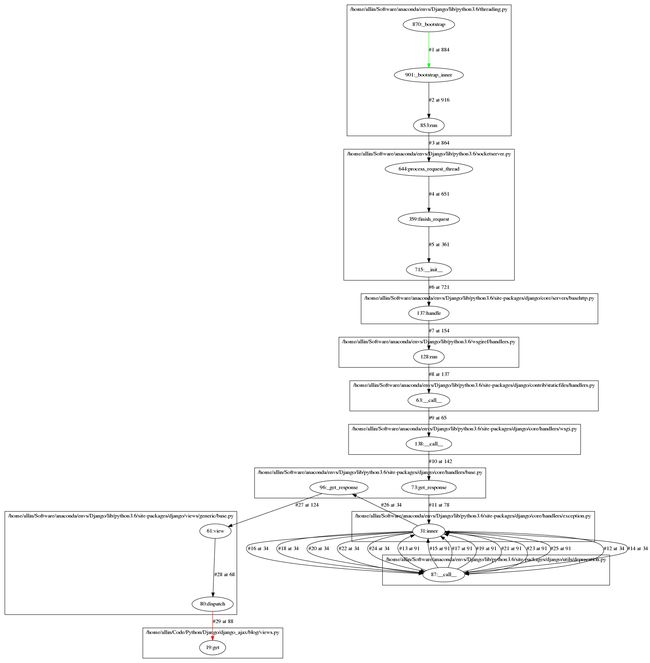
解决方案2的结果图

解决方案3(用Flask来示范)
from flask import Flask

app = Flask(__name__)


@app.route('/')
def index():
    import traceback
    traceback.print_stack()
    return 'Yet another hello!'

if __name__ == '__main__':
    app.run()
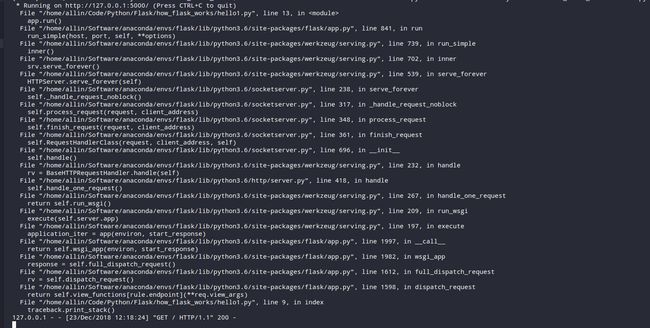
解决方案3的结果图


