python操作Excel、读取CVS与数据可视化
python操作Excel、读取CVS与数据可视化
目录
- 1. python操作Excel
- 1.1 xlsxwriter模块介绍
- 1.1.1 Workbook类
- 1.1.2 Worksheet类
- 1.1.3 Chart类
- 1.2 excel写入及绘图
- 1.2.1 折线图
- 1.2.2 柱状图
- 1.2.3 饼图
- 1.1 xlsxwriter模块介绍
- 2. python操作cvs文件
- 2.1 csv文件简介
- 2.2 python读写cvs文件
- 2.3 pandas读取cvs数据及可视化
- 3. 总结
1. python操作Excel
python操作Excel有多种module可以实现(xlrd、xlwt、xlutils、openpyxl、xlsxwriter),本文使用xlsxwriter这个module,官方链接地址。xlsxwriter支持在Excel 2007之后版本的xlsx文件中编写多个工作表的文本、数字、公式和超链接。本文中用到的类主要有Workbook、Worksheet、Chart,对Excel进行数据写入和生成折线图、柱状图、饼图。
1.1 xlsxwriter模块介绍
1.1.1 Workbook类
Workbook是xlsxwriter模块的主类,对excel文件的操作都需要通过这个类,表示在excel中看到的整个电子表格。
| 函数名 | 功能 | 返回值 | 备注 |
|---|---|---|---|
| Workbook(filename[, options]) | 构造函数--根据传入的文件名创建Workbook对象 | Workbook对象 | |
| add_worksheet([name]) | 为excel文件添加一个worksheet | worksheet对象 | 不指定名字默认为sheet1、sheet2... |
| add_format([properties]) | 创建一个format对象 | 格式化对象 | |
| add_chart(options) | 创建一个Chart对象 | Chart对象 | |
| close() | 关闭打开的xlsx文件并进行写入 | 无 |
1.1.2 Worksheet类
Worksheet类表示一个Excel工作表,处理向单元格写入数据或格式化工作布局等操作。
| 函数名 | 功能 | 返回值 | 备注 |
|---|---|---|---|
| write_row(row, col, data[, cell_format]) | 以某个单元格作为起始写入行数据 | 0--成功 其他--失败 | 可以通过(row,col)来索引单元格,也可以通过'A1'、'A2'的形式 |
| write_column(row, col, data[, cell_format]) | 以某个单元格作为起始写入列数据 | 0--成功 其他--失败 | 同上 |
| insert_chart(row, col, chart[, options]) | 在worksheet中插入一个chart | 0--成功 -1--索引越界 | (row, col)用于指定chart的显示位置 |
1.1.3 Chart类
Chart类是xlsxwriter中用来操作图表的类,通过workbook.add_chart函数创建Chart对象。
| 函数名 | 功能 | 返回值 | 备注 |
|---|---|---|---|
| add_series(options) | 向图表中添加数据序列 | ||
| set_title(options) | 设置图表标题 | ||
| set_x_axis(options) | 设置X轴 | ||
| set_y_axis(options) | 设置Y轴 | ||
| set_style(style_id) | 设置图表样式类型 |
1.2 excel写入及绘图
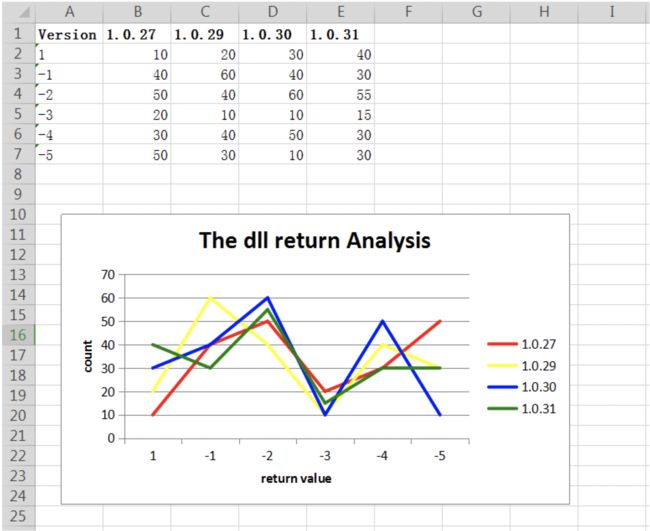
1.2.1 折线图
# -*- coding:utf-8 -*-

import xlsxwriter

# 创建一个excel
workbook = xlsxwriter.Workbook("chart_line.xlsx")
# 创建一个sheet
worksheet = workbook.add_worksheet()
# 自定义样式,加粗
bold = workbook.add_format({'bold': 1})
# --------1、准备数据并写入excel---------------
# 向excel中写入数据,建立图标时要用到
headings = ['Version', '1.0.27', '1.0.29', '1.0.30', '1.0.31']
data = [
    ['1', '-1', '-2', '-3', '-4', '-5'],
    [10, 40, 50, 20, 30, 50],
    [20, 60, 40, 10, 40, 30],
    [30, 40, 60, 10, 50, 10],
    [40, 30, 55, 15, 30, 30]
]
# 写入表头
worksheet.write_row('A1', headings, bold)
# 写入数据
worksheet.write_column('A2', data[0])
worksheet.write_column('B2', data[1])
worksheet.write_column('C2', data[2])
worksheet.write_column('D2', data[3])
worksheet.write_column('E2', data[4])
# --------2、生成图表并插入到excel---------------
# 创建一个柱状图(line chart)
chart_col = workbook.add_chart({'type': 'line'})
# 配置第1个系列数据
chart_col.add_series({
    # 这里的Sheet1是默认的值
    'name': '=Sheet1!$B$1',
    'categories': '=Sheet1!$A$2:$A$7',
    'values':   '=Sheet1!$B$2:$B$7',
    'line': {'color': 'red'},
})
# 配置第2个系列数据
chart_col.add_series({
    'name': '=Sheet1!$C$1',
    'categories':  '=Sheet1!$A$2:$A$7',
    'values':   '=Sheet1!$C$2:$C$7',
    'line': {'color': 'yellow'},
})
# 配置第二个系列数据
chart_col.add_series({
    'name': '=Sheet1!$D$1',
    'categories':  '=Sheet1!$A$2:$A$7',
    'values':   '=Sheet1!$D$2:$D$7',
    'line': {'color': 'blue'},
})
# 配置第二个系列数据
chart_col.add_series({
    'name': '=Sheet1!$E$1',
    'categories':  '=Sheet1!$A$2:$A$7',
    'values':   '=Sheet1!$E$2:$E$7',
    'line': {'color': 'green'},
})
# 设置图表的title 和 x,y轴信息
chart_col.set_title({'name': 'The dll return Analysis'})
chart_col.set_x_axis({'name': 'return value'})
chart_col.set_y_axis({'name':  'count'})
# 设置图表的风格
chart_col.set_style(1)
# 把图表插入到worksheet并设置偏移
worksheet.insert_chart('A10', chart_col, {'x_offset': 25, 'y_offset': 10})
# 关闭文件
workbook.close()
1.2.2 柱状图
# -*- coding:utf-8 -*-
import xlsxwriter

# 创建一个excel
workbook = xlsxwriter.Workbook("chart_column.xlsx")
# 创建一个sheet
worksheet = workbook.add_worksheet()

# 自定义样式,加粗
bold = workbook.add_format({'bold': 1})

# --------1、准备数据并写入excel---------------
headings = ['Version', '1.0.27', '1.0.29', '1.0.30', '1.0.31']
data = [
    ['1', '-1', '-2', '-3', '-4', '-5'],
    [10, 40, 50, 20, 30, 50],
    [20, 60, 40, 10, 40, 30],
    [30, 40, 60, 10, 50, 10],
    [40, 30, 55, 15, 30, 30]
]

# 写入表头
worksheet.write_row('A1', headings, bold)

# 写入数据
worksheet.write_column('A2', data[0], bold)
worksheet.write_column('B2', data[1])
worksheet.write_column('C2', data[2])
worksheet.write_column('D2', data[3])
worksheet.write_column('E2', data[4])

# --------2、生成图表并插入到excel---------------
# 创建一个柱状图(column chart)
chart_col = workbook.add_chart({'type': 'column'})

# 配置第1个系列数据
chart_col.add_series({
    # sheet1是默认的值
    'name': '=Sheet1!$B$1',
    'categories': '=Sheet1!$A$2:$A$7',
    'values': '=Sheet1!$B$2:$B$7',
    'fill': {'color': 'red', 'transparency': 30},
})

# 配置第2个系列数据
chart_col.add_series({
    'name': '=Sheet1!$C$1',
    'categories': '=Sheet1!$A$2:$A$7',
    'values': '=Sheet1!$C$2:$C$7',
    'fill': {'color': 'blue', 'transparency': 30},
})

# 配置第3个系列数据
chart_col.add_series({
    'name': '=Sheet1!$D$1',
    'categories':  '=Sheet1!$A$2:$A$7',
    'values':   '=Sheet1!$D$2:$D$7',
    'fill': {'color': 'green', 'transparency': 30},
})

# 配置第4个系列数据
chart_col.add_series({
    'name': '=Sheet1!$E$1',
    'categories': '=Sheet1!$A$2:$A$7',
    'values': '=Sheet1!$E$2:$E$7',
    'fill': {'color': 'yellow', 'transparency': 30},
})

# 设置图表的title 和 x,y轴信息
chart_col.set_title({'name': 'The dll return Analysis'})
chart_col.set_x_axis({'name': 'return value'})
chart_col.set_y_axis({'name':  'count'})

# 设置图表的风格
chart_col.set_style(1)

# 把图表插入到worksheet以及偏移
worksheet.insert_chart('A10', chart_col, {'x_offset': 25, 'y_offset': 10})

workbook.close()
1.2.3 饼图
# -*- coding:utf-8 -*-
import xlsxwriter

# 创建一个excel
workbook = xlsxwriter.Workbook("chart_pie.xlsx")
# 创建一个sheet
worksheet = workbook.add_worksheet()

# 自定义样式,加粗
bold = workbook.add_format({'bold': 1})

# --------1、准备数据并写入excel---------------
# 向excel中写入数据,建立图标时要用到
data = [
    ['1.0.27', '1.0.29', '1.0.30', '1.0.31'],
    [32, 23, 18, 25],
]

# 写入数据
worksheet.write_row('A1', data[0], bold)
worksheet.write_row('A2', data[1])

# --------2、生成图表并插入到excel---------------
# 创建一个柱状图(pie chart)
chart_col = workbook.add_chart({'type': 'pie'})

# 配置第一个系列数据
chart_col.add_series({
    'name': 'Bug Counts',
    'categories': '=Sheet1!$A$1:$D$1',
    'values': '=Sheet1!$A$2:$D$2',
    'points': [
        {'fill': {'color': '#BC3FBC'}},
        {'fill': {'color': '#0DAD48'}},
        {'fill': {'color': '#D8B31C'}},
        {'fill': {'color': 'gray'}},
    ],

})

# 设置图表的title 和 x,y轴信息
chart_col.set_title({'name': 'Bug Counts'})

# 设置图表的风格,excel内置48种图表样式
chart_col.set_style(25)

# 把图表插入到worksheet以及坐标位置
worksheet.insert_chart('B10', chart_col, {'x_offset': 25, 'y_offset': 10})
workbook.close()
2. python操作cvs文件
2.1 csv文件简介
Comma-Separated Values逗号分隔值,其文件以纯文本的形式存储表格数据,广泛应用在程序之间转移表格数据,如何可以将csv直接在Excel中以表格的形式打开,也可以作为源数据直接导入到数据库当中。文件类似如下的形式,
OcrVersion,OcrResult,TimeExpend
1.0.0.27,-5,33.61749870069975
1.0.0.27,1,124.42219042629038
1.0.0.27,1,86.97660413336142
1.0.0.27,1,97.52896716737031
1.0.0.27,-5,0.48869203305051956
1.0.0.27,-5,0.5020905159192068
1.0.0.27,-5,0.4943334995215487
2.2 python读写cvs文件
2.3 pandas读取cvs数据及可视化
3. 总结
posted @ 2019-01-31 23:52 Blue影 阅读(...) 评论(...) 编辑 收藏


