【python】Matplotlib+tushare接口绘制动态股票数据
Matplotlib+tushare接口绘制动态股票数据-python
tushare是财经数据的接口包
tushare接口需要下载tushare库
cmd》pip install tushare
可能会因为网络问题下不下来,多试几次
用到的包
【code1】
from time import sleep
from threading import Thread
import numpy as np
import matplotlib.pyplot as plt
from matplotlib.widgets import Button
from matplotlib.widgets import TextBox
from matplotlib import animation
import pandas as pd
#import datetime
import tushare as ts
import tushare as ts后使用ts.get_hist_data()方法进行数据的获取
import tushare as ts
def gethist(self,code):
		#code为股票代码,如“600456”
        global path
        df = ts.get_hist_data(code)
        #print(df)
        path="C://Users//Administrator//Desktop//python9//"#这里是保存路径
        csvname=str(code)+".csv"
        df.to_csv(path+csvname)
重写一下代码,把数据处理成老师要求的格式。
    def stock_history_data_get(self,code):
        df = ts.get_hist_data(code,start='2018-03-15',end='2019-04-16')
        df_v1 = df.reset_index()

        df_v2=df_v1[['date','close','p_change']].sort_values(by='date', ascending= True)
        df_v2['p_change'] = df_v2['p_change']*0.01
        stv_4 = [0, 0, 0]
        stv_8 = [0, 0, 0, 0, 0, 0, 0]
        stv_12 = [0, 0, 0, 0, 0, 0, 0, 0, 0, 0, 0]
        stv_16 = [0, 0, 0, 0, 0, 0, 0, 0, 0, 0, 0, 0, 0, 0, 0]
        for i in range(0,len(df_v2)):
            sample = list(df_v2['p_change'][i:i+4])
            stv = np.std(sample)
            stv_4.append(stv)
            if i == len(df_v2)-4:
                break
        df_v2['stv_4'] = stv_4
        for i in range(0,len(df_v2)):
            sample = list(df_v2['p_change'][i:i + 8])
            stv = np.std(sample)
            stv_8.append(stv)
            if i == len(df_v2)-8:
                break
        df_v2['stv_8'] = stv_8
        for i in range(0,len(df_v2)):
            sample = list(df_v2['p_change'][i:i + 12])
            stv = np.std(sample)
            stv_12.append(stv)
            if i == len(df_v2)-12:
                break
        df_v2['stv_12'] = stv_12
        for i in range(0,len(df_v2)):
            sample = list(df_v2['p_change'][i:i + 16])
            stv = np.std(sample)
            stv_16.append(stv)
            if i == len(df_v2)-16:
                break
        df_v2['stv_16'] = stv_16
        df_v2['hv_4'] = round(df_v2['stv_4'] * 12 * 1040,2).apply(lambda x: '%.2f%%' % (x))
        df_v2['hv_8'] = round(df_v2['stv_8'] * 12 * 1040,2).apply(lambda x: '%.2f%%' % (x))
        df_v2['hv_12'] = round(df_v2['stv_12'] * 12 * 1040,2).apply(lambda x: '%.2f%%' % (x))
        df_v2['hv_16'] = round(df_v2['stv_16'] * 12 * 1040,2).apply(lambda x: '%.2f%%' % (x))
        df_v2.to_csv(code+'.csv', index=True)
stock_history_data_get处理好后csv中的部分数据

现在开始直接用matplotlib画图.
有余力的人可以选择用wxpython画。
【code2】
pd.set_option('display.max_rows', 10000)
pd.set_option('display.max_columns', 10000)
pd.set_option('max_colwidth',100)
pd.set_option('display.width',10000)
figure=plt.figure(num='爷爷图', figsize=(5, 4), dpi=120, edgecolor='g')
global ax1
ax1=figure.add_subplot(111)
figure.subplots_adjust(bottom=0.2)#设置距离底部空出0.2

global w
global df
path="C://Users//Administrator//Desktop//python9//"
先设置一些参数,造一个figure出来,然后在figure上添加子图ax1,设置保存路径path
这个函数用于在ax1上画图,code是股票代码,我因为设置存储的csv的name就是股票代码(比如600456.csv),所以取数据也用code+.csv来取
def readcsv_drawplt(code):
    global df
    df = pd.read_csv(path+code+".csv",header=0)
    t = range(0,150,1)
    #s = df.p_change[:150]
    s=df.hv_4[:150]#老师要求取hv_4这一行作图,那就取这个吧
    ss=[]
    for x in s:
        x=float(str(x.strip("%")))
        ss.append(x)
    ax1.plot(t, ss, lw=2)
    ax1.set_title("test:"+code)
在figure上画Button,Button的大小和位置我懒得调了
【code4】
eadcsv_drawplt("600618")
callback = ButtonHandler()
axprev =figure.add_axes([0.81, 0.05, 0.1, 0.075])
bprev = Button(axprev, 'Stop')
bprev.on_clicked(callback.Stop)
axnext = figure.add_axes([0.7, 0.05, 0.1, 0.075])
bnext = Button(axnext, 'Start')
bnext.on_clicked(callback.Start)
axddd =figure.add_axes([0.55, 0.05, 0.1, 0.075])
cnext = Button(axddd, 'Download')
cnext.on_clicked(callback.Download)
axentry = figure.add_axes([0.40, 0.05, 0.1, 0.075])

w = TextBox(axentry, 'input code',initial='50')
plt.show()
接下来构造ButtonHandler类好了,毕竟我拿到的demo是有这个类的。
【code3】
class ButtonHandler():
    def __init__(self):
        #self.readcsv_drawplt("50")
        self.flag = True
        self.range_s, self.range_e, self.range_step = 0, 150, 1
    def init_reset(self):
        self.flag = True
        self.range_s, self.range_e, self.range_step = 0, 150, 1
    def threadStart(self):
        #figure_s=plt.figure(num='动图', figsize=(5, 4), dpi=120, edgecolor='g')
        #ax_s=figure_s.add_subplot(1,1,1)
        #ax_s.grid(color='b', linestyle='--', linewidth=1,alpha=0.3)
        #self.readcsv_drawplt("50");
        global df
        while self.flag:
            sleep(0.3)
            self.range_s += self.range_step
            self.range_e += self.range_step
            t = np.arange(self.range_s, self.range_e, self.range_step)
            s=df.hv_4[self.range_s:self.range_e]
            #print(len(s),len(t))
            ss=[]
            for x in s:
                x=float(str(x.strip("%")))
                ss.append(x)
            # ydata =df.p_change[self.range_s:self.range_e]
            ydata=ss
            #ax.set_xdata(t - t[0])
            #ax.set_ydata(ydata)
            ax1.cla() #清空画布上的所有内容
            #plt.plot(t,ydata,'-r')
            ax1.plot(t, ydata, lw=2)
            ax1.set_title("running")
            plt.draw()
            #plt.pause(0.3)
            #ax1.draw()
            #plt.show()
    def Download(self, event):
        print("[Download func]",w.text)
        textcode=w.text
        self.init_reset()
        if(textcode!="50"):
            #self.gethist(w.text)
            #plt.clf() #清空画布上的所有内容
            ax1.cla()
            self.stock_history_data_get(textcode)
            readcsv_drawplt(textcode)
    def Start(self, event):
        print("[Start func]","had startted!")
        self.flag = True
        t = Thread(target=self.threadStart)
        t.setDaemon(True)
        t.start()

    def Stop(self, event):
        print("[Stop func]","had stopped!")
        self.flag = False
    def gethist(self,code):
        global path
        df = ts.get_hist_data(code)
        #print(df)
        #path="C://Users//Administrator//Desktop//python9//"
        csvname=str(code)+".csv"
        df.to_csv(path+csvname)
    def stock_history_data_get(self,code):
        df = ts.get_hist_data(code,start='2018-03-15',end='2019-04-16')
        df_v1 = df.reset_index()

        df_v2=df_v1[['date','close','p_change']].sort_values(by='date', ascending= True)
        df_v2['p_change'] = df_v2['p_change']*0.01
        stv_4 = [0, 0, 0]
        stv_8 = [0, 0, 0, 0, 0, 0, 0]
        stv_12 = [0, 0, 0, 0, 0, 0, 0, 0, 0, 0, 0]
        stv_16 = [0, 0, 0, 0, 0, 0, 0, 0, 0, 0, 0, 0, 0, 0, 0]
        for i in range(0,len(df_v2)):
            sample = list(df_v2['p_change'][i:i+4])
            stv = np.std(sample)
            stv_4.append(stv)
            if i == len(df_v2)-4:
                break
        df_v2['stv_4'] = stv_4
        for i in range(0,len(df_v2)):
            sample = list(df_v2['p_change'][i:i + 8])
            stv = np.std(sample)
            stv_8.append(stv)
            if i == len(df_v2)-8:
                break
        df_v2['stv_8'] = stv_8
        for i in range(0,len(df_v2)):
            sample = list(df_v2['p_change'][i:i + 12])
            stv = np.std(sample)
            stv_12.append(stv)
            if i == len(df_v2)-12:
                break
        df_v2['stv_12'] = stv_12
        for i in range(0,len(df_v2)):
            sample = list(df_v2['p_change'][i:i + 16])
            stv = np.std(sample)
            stv_16.append(stv)
            if i == len(df_v2)-16:
                break
        df_v2['stv_16'] = stv_16
        df_v2['hv_4'] = round(df_v2['stv_4'] * 12 * 1040,2).apply(lambda x: '%.2f%%' % (x))
        df_v2['hv_8'] = round(df_v2['stv_8'] * 12 * 1040,2).apply(lambda x: '%.2f%%' % (x))
        df_v2['hv_12'] = round(df_v2['stv_12'] * 12 * 1040,2).apply(lambda x: '%.2f%%' % (x))
        df_v2['hv_16'] = round(df_v2['stv_16'] * 12 * 1040,2).apply(lambda x: '%.2f%%' % (x))
        df_v2.to_csv(code+'.csv', index=True)
ok~整个代码顺序:【code1】【code2】【code4】【code3】结果:
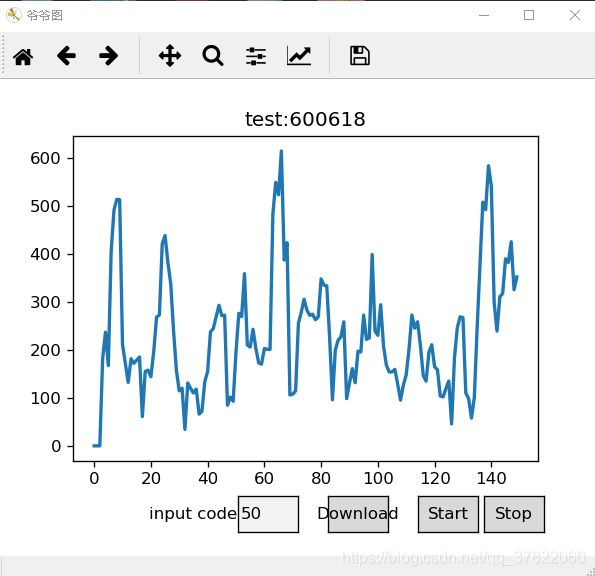 600456貌似取到的数据只有几十行所以画不上去,所以我Download了5600777的数据
点击start就可以动了~,点击stop就能停下。
可能还有一些bug,但整体能交差了hhh