图像特征检测方法—SIFT的Python实现
VLFeat 以及 SIFT 相关资源
实现平台:Win64 + Pycharm/anaconda
VLFeat工具包: 官方下载链接下载www.vlfeat.org。建议下载VLFeat0.9.20
****使用win64下的sift,可能会出现查找不到test.sift。
1)使用win32代替VLFeat/win64”
解决方案: cmmd = str("D:\PCV\VLFeat\win32\sift.exe "+imagename+" --output="+resultname+ " "+params)
2) 点击“win32”文件夹里的“sift.exe”时,系统提示“无法启动此程序,vcomp100.dll丢失”。 下载“vcomp100.dll”,放到了“目录C:\Windows\SysWOW64”下(64位系统),解决问题。 然后再点击“win32”文件夹里的“sift.exe”时,系统不会提示错误,而是命令行的窗口一闪而过,此时就可以运行了
sift描述子
在过去的十年间,最成功的图像局部描述子之一是尺度不变特征变换(SIFT),它是由David Lowe发明的。SIFT在2004年由Lowe完善并经受住了时间的考验。关于SIFT原理的详细介绍,可以参阅中译本,在WIKI上你可以看一个简要的概览。
2.2.1 兴趣点
2.2.2 描述子
2.2.3 检测感兴趣点
为了计算图像的SIFT特征,我们用开源工具包VLFeat。用Python重新实现SIFT特征提取的全过程不会很高效,而且也超出了本书的范围。VLFeat可以在www.vlfeat.org上下载,它的二进制文件可以用于一些主要的平台。这个库是用C写的,不过我们可以利用它的命令行接口。此外,它还有Matlab接口。下面代码是再现原书P40页的代码:
# -*- coding: utf-8 -*-
from PIL import Image
from pylab import *
from PCV.localdescriptors import sift
from PCV.localdescriptors import harris

# 添加中文字体支持
from matplotlib.font_manager import FontProperties
font = FontProperties(fname=r"c:\windows\fonts\SimSun.ttc", size=14)

imname = '01.jpg'
im = array(Image.open(imname).convert('L'))
sift.process_image(imname, '01.sift')
l1, d1 = sift.read_features_from_file('01.sift')

figure()
gray()
subplot(131)
sift.plot_features(im, l1, circle=False)
title(u'SIFT特征',fontproperties=font)
subplot(132)
sift.plot_features(im, l1, circle=True)
title(u'用圆圈表示SIFT特征尺度',fontproperties=font)

# 检测harris角点
harrisim = harris.compute_harris_response(im)

subplot(133)
filtered_coords = harris.get_harris_points(harrisim, 6, 0.1)
imshow(im)
plot([p[1] for p in filtered_coords], [p[0] for p in filtered_coords], '*')
axis('off')
title(u'Harris角点',fontproperties=font)

show()
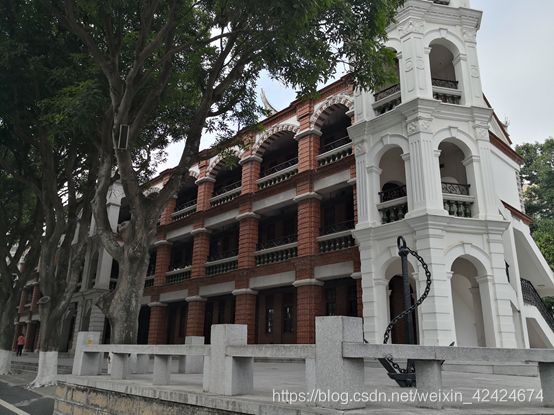
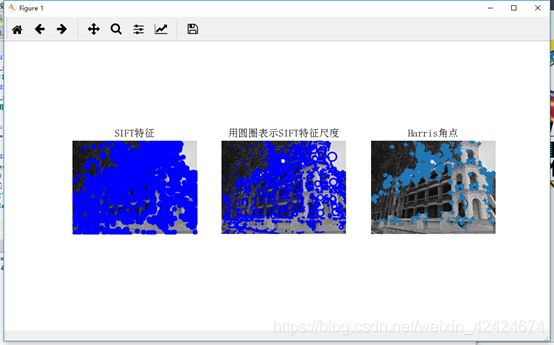
运行上面代码,可以将下图(集美大学航海学院)得出结果:
2.2.4 描述子匹配
from PIL import Image
from pylab import *
import sys
from PCV.localdescriptors import sift


if len(sys.argv) >= 3:
  im1f, im2f = sys.argv[1], sys.argv[2]
else:
#  im1f = '../data/sf_view1.jpg'
#  im2f = '../data/sf_view2.jpg'
  im1f = '02.jpg'
  im2f = '03.jpg'
#  im1f = '../data/climbing_1_small.jpg'
#  im2f = '../data/climbing_2_small.jpg'
im1 = array(Image.open(im1f))
im2 = array(Image.open(im2f))

sift.process_image(im1f, 'out_sift_1.txt')
l1, d1 = sift.read_features_from_file('out_sift_1.txt')
figure()
gray()
subplot(121)
sift.plot_features(im1, l1, circle=False)

sift.process_image(im2f, 'out_sift_2.txt')
l2, d2 = sift.read_features_from_file('out_sift_2.txt')
subplot(122)
sift.plot_features(im2, l2, circle=False)

#matches = sift.match(d1, d2)
matches = sift.match_twosided(d1, d2)
print( '{} matches'.format(len(matches.nonzero()[0])))
figure()
gray()
sift.plot_matches(im1, im2, l1, l2, matches, show_below=True)
show()
运行代码,结果如下(集美大学本部):
注意:图片大小要一样
2.3 地理标记图像匹配
2.3.1 局部描述子匹配
2.3.2 可视化图像连接
关于pydot问题解决
1.打开解压,找到图标![]()
3.打开cmd命令框 输入一下语句,
conda install pydot-ng
conda install graphviz
有点慢。。。
*还有一种更直接的方式:找到graphviz文件中的bin,dot.exe文件,把路径加到系统环境和用户环境中。
(2)
出现这种问题。不断换版本就是了,从VLFeat0.9.20到VLFeat0.9.17.。。
sift.process_image(imname, 'empire.sift')这个函数没有生成empire.sift,所以sift.read_features_from_file('empire.sift')找不到empire.sift而报错,你可以注释掉下面那些代码,调试sift.process_image(imname, 'empire.sift')直到目录下有出现empire.sift,再把下面的代码去掉注释就可以了。
代码实例
# -*- coding: utf-8 -*-
from pylab import *
from PIL import Image
from PCV.localdescriptors import sift
from PCV.tools import imtools
import pydot

""" This is the example graph illustration of matching images from Figure 2-10.
To download the images, see ch2_download_panoramio.py."""

#download_path = "panoimages"  # set this to the path where you downloaded the panoramio images
#path = "/FULLPATH/panoimages/"  # path to save thumbnails (pydot needs the full system path)

download_path = "D:\SHPIL\JMU"  # set this to the path where you downloaded the panoramio images
path = "D:\SHPIL\JMU"  # path to save thumbnails (pydot needs the full system path)

# list of downloaded filenames
imlist = imtools.get_imlist(download_path)
nbr_images = len(imlist)

# extract features
featlist = [imname[:-3] + 'sift' for imname in imlist]
for i, imname in enumerate(imlist):
    sift.process_image(imname, featlist[i])

matchscores = zeros((nbr_images, nbr_images))

for i in range(nbr_images):
    for j in range(i, nbr_images):  # only compute upper triangle
        print ('comparing ', imlist[i], imlist[j])
        l1, d1 = sift.read_features_from_file(featlist[i])
        l2, d2 = sift.read_features_from_file(featlist[j])
        matches = sift.match_twosided(d1, d2)
        nbr_matches = sum(matches > 0)
        print ('number of matches = ', nbr_matches)
        matchscores[i, j] = nbr_matches
print ("The match scores is: \n", matchscores)

# copy values
for i in range(nbr_images):
    for j in range(i + 1, nbr_images):  # no need to copy diagonal
        matchscores[j, i] = matchscores[i, j]

#可视化

threshold = 2  # min number of matches needed to create link

g = pydot.Dot(graph_type='graph')
root="D:\\SHPIL\\JMU"
for i in range(nbr_images):
    for j in range(i + 1, nbr_images):
        if matchscores[i, j] > threshold:
            # first image in pair
            im = Image.open(imlist[i])
            im.thumbnail((100, 100))
            filename = root + str(i) + '.jpg'
            im.save(filename)  # need temporary files of the right size
            g.add_node(pydot.Node(str(i), fontcolor='transparent', shape='rectangle', image=filename))
            # second image in pair
            im = Image.open(imlist[j])
            im.thumbnail((100, 100))
            filename = root + str(j) + '.jpg'
            im.save(filename)  # need temporary files of the right size
            g.add_node(pydot.Node(str(j), fontcolor='transparent', shape='rectangle', image=filename))
            g.add_edge(pydot.Edge(str(i), str(j)))
g.write_png('jmu.png')
运行结果:(图源:集美大学本部风景)


