梯度下降法实现线性回归, 实例---预测波士顿房价
本文先手动实现一个线性回归模型, 然后用sklearn的线性回归模型作对比
import pandas as pd
df = pd.read_csv('house_data.csv')  #数据集可到网上下载,波士顿房价
df.head()
Out[1]:
| CRIM | ZN | INDUS | CHAS | NOX | RM | AGE | DIS | RAD | TAX | PTRATIO | B | LSTAT | MEDV | |
|---|---|---|---|---|---|---|---|---|---|---|---|---|---|---|
| 0 | 0.00632 | 18.0 | 2.31 | 0 | 0.538 | 6.575 | 65.2 | 4.0900 | 1 | 296 | 15.3 | 396.90 | 4.98 | 24.0 |
| 1 | 0.02731 | 0.0 | 7.07 | 0 | 0.469 | 6.421 | 78.9 | 4.9671 | 2 | 242 | 17.8 | 396.90 | 9.14 | 21.6 |
| 2 | 0.02729 | 0.0 | 7.07 | 0 | 0.469 | 7.185 | 61.1 | 4.9671 | 2 | 242 | 17.8 | 392.83 | 4.03 | 34.7 |
| 3 | 0.03237 | 0.0 | 2.18 | 0 | 0.458 | 6.998 | 45.8 | 6.0622 | 3 | 222 | 18.7 | 394.63 | 2.94 | 33.4 |
| 4 | 0.06905 | 0.0 | 2.18 | 0 | 0.458 | 7.147 | 54.2 | 6.0622 | 3 | 222 | 18.7 | 396.90 | 5.33 | 36.2 |
In [2]:
import matplotlib.pyplot as plt
import seaborn as sns
import numpy as np
sns.set(context='notebook')

cols = ['MEDV', 'LSTAT', 'AGE', 'DIS', 'CRIM', 'TAX', 'RM']
sns.pairplot(df[cols], height=2.5)
Out[2]:
In [3]:
from sklearn import datasets
dataset = datasets.load_boston()  #也可以通过sklearn加载数据集
实现线性回归模型
In [4]:
class LinearRegressionByMyself(object):
    def __init__(self, Learning_rate=0.001, epoch=20):
        self.Learning_rate = Learning_rate
        self.epoch = epoch

    def fit(self, X, y):
        self.w = np.zeros(1 + X.shape[1])
        self.cost_list = []

        for i in range(self.epoch):
            output = self.Regression_input(X)
            #shape重置, 这里需要注意矩阵的运算问题
            output = output.T.reshape(y.shape)

            error = (y - output)
            #shape重置
            self.w[1:] += self.Learning_rate * X.T.dot(error).reshape(-1,)

            self.w[0] += self.Learning_rate * error.sum()
            cost = (error ** 2).sum() / 2.0
            self.cost_list.append(cost)
        return self

    def Regression_input(self, X):
        return np.dot(X, self.w[1:]) + self.w[0]

    def predict(self, X):
        return self.Regression_input(X)
模型写完了, 开始准备数据, 并且做数据的预处理 fit_transformIn [5]:
from sklearn.preprocessing import StandardScaler
X = df[['LSTAT']].values   # 这里只去了一维数据
y = df[['MEDV']].values
y = y.reshape(-1,1)

StandardScaler_x = StandardScaler()
StandardScaler_y = StandardScaler()
X_standard = StandardScaler_x.fit_transform(X)
y_standard = StandardScaler_y.fit_transform(y)
实际开始跑模型
In [6]:
model = LinearRegressionByMyself()
model.fit(X_standard, y_standard)
Out[6]:
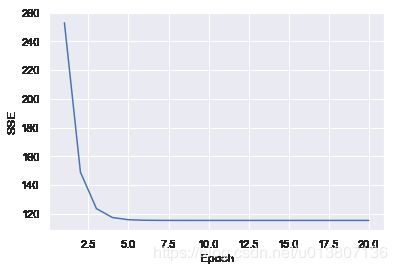
<__main__.LinearRegressionByMyself at 0x1172c0898>画出模型的损失值随着epoch变化的折线图
可见前三次变化很大, 后面趋于稳定
In [7]:
plt.plot(range(1, model.epoch+1), model.cost_list)
plt.ylabel('SSE')
plt.xlabel('Epoch')
Out[7]:
In [8]:
def Regression_plot(X, y, model):
    plt.scatter(X, y, c='blue')
    plt.plot(X, model.predict(X), color='red')
    return None
In [8]:
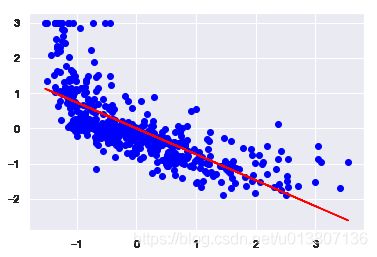
Regression_plot(X_standard, y_standard, model)模型已经完成了, 上图看起来效果还不错, 接下来做个实际的预测吧
In [9]:
#这里要注意手动实现的数据, 是做了transform预处理的, 输出实际预测值是还要inverse_transform还原预测值
Rercentage_standard = StandardScaler_x.transform([[23]])
Price_standard = model.predict(Rercentage_standard)
StandardScaler_y.inverse_transform(Price_standard)
Out[9]:
array([ 12.70271311])使用sklearn构建线性模型
In [10]:
from sklearn.linear_model import LinearRegression
sk_model = LinearRegression()
sk_model.fit(X,y)
print(sk_model.coef_, sk_model.intercept_)
[[-0.95004935]] [ 34.55384088]
sklearn 只需要3行代码就能实现预测了, 很方便, 还不用数据预处理
In [11]:
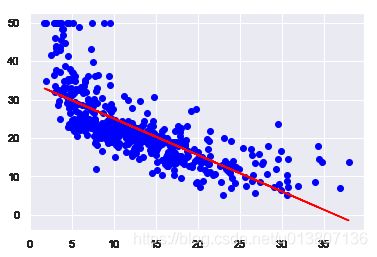
Regression_plot(X, y, sk_model)In [12]:
sk_model.predict(23) #实际预测结果Out[13]:
array([[ 12.70270574]])

