Machine Learning in Action 5. Logistic Regression
1. Logistic Regression
解决问题: 二分类问题(binary classification)
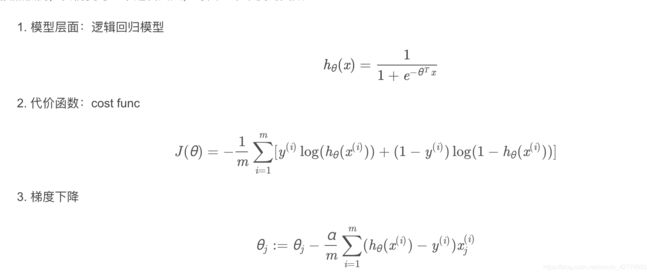
分类器: 为了实现logistic回归分类器,可以在每个特征上都乘以一个回归系数(权重),把所有结果值相加,总和(y= w1x1+w2x2+…+b)代入sigmoid函数中,从而得到一个范围在0-1之间的数值。任何大于0.5的数被分入1类,小于0.5被分入0类。 所以logistic regression可以堪称是一种概率估计。
损失函数/代价函数:对数似然损失(crossentropy 交叉熵) 公式如下图2
优化方法: 梯度下降 如图3

2. 如何用Python的内置函数直接完成logistic regression
# Step1: Import the required modules
from sklearn.datasets import make_classification
from matplotlib import pyplot as plt
from sklearn.linear_model import LogisticRegression
from sklearn.model_selection import train_test_split
from sklearn.metrics import confusion_matrix
import pandas as pd
# Step2: Generate the dataset
# Generate and dataset for Logistic Regression
x, y = make_classification(
    n_samples=100,
    n_features=1,
    n_classes=2,
    n_clusters_per_class=1,
    flip_y=0.03,
    n_informative=1,
    n_redundant=0,
    n_repeated=0
)
Step 3: Visualize the Data
# Create a scatter plot
plt.scatter(x, y, c=y, cmap='rainbow')
plt.title('Scatter Plot of Logistic Regression')
plt.show()
Step 4: Split the Dataset
# Split the dataset into training and test dataset
x_train, x_test, y_train, y_test = train_test_split(x, y, random_state=1)
Step 5: Perform Logistic Regression
# Create a Logistic Regression Object, perform Logistic Regression
log_reg = LogisticRegression()
log_reg.fit(x_train, y_train)

LogisticRegression(C=1.0, class_weight=None, dual=False, fit_intercept=True,
          intercept_scaling=1, max_iter=100, multi_class='ovr', n_jobs=1,
          penalty='l2', random_state=None, solver='liblinear', tol=0.0001,
          verbose=0, warm_start=False)

# Show to Coeficient and Intercept
print(lr.coef_)
print(lr.intercept_)
Step 6: Make prediction using the model
# Perform prediction using the test dataset
y_pred = lr.predict(x_test)
Step 7: Display the Confusion Matrix
# Show the Confusion Matrix
confusion_matrix(y_test, y_pred)

array([[13,  1],
       [ 0, 11]], dtype=int64)