R语言 功能随笔 |实用
记录用到的R语言中的一些功能
先造一些数据
a <- data.frame(first=c(1:5),second=c(6:10),third=c(11:15))
>  first second third
 1     1      6    11
 2     2      7    12
 3     3      8    13
 4     4      9    14
 5     5     10    15
1. 选择一列中具有特定值的某几项
比如选出‘second’这一列中能被2整除的元素
> a$second[which((a$second%%2)==0)]
[1] 6 8 10
- $: 通过列的名称访问dataframe中的某一列
- second[ ]: 访问second这一列中的某些元素
- which( ): which的括号里面填筛选的条件,这里是能被2整除(%%)
  也可以是 a$second==7 这样的
  若有多个筛选条件,用与(&)连接
  e.g. ((a$second%%2)==0 & a$second==7)
2. mean() 求平均数
用mean()求平均数时,若数据中有空值,则求不出平均数
所以要用 na.rm = TRUE 来忽略空值
#因为first中没有空值,所以这只是个例子
> mean(a$first, na.rm = TRUE)
sd() 中也可以用
3. 判断数据中有无空值
判断了,好决定要不要用na.rm
na.rm(x) : 判断x中是否含有空值
> is.na(a$first)
4. 为一个向量赋相同初值
比如让向量b中有20个5(让长度为20的数组里的所有值都为5)
> b <- rep(5, 20)
[1] 5 5 5 5 5 5 5 5 5 5 5 5 5 5 5 5 5 5 5 5
rep(x, times)
x 为想重复的数
times为重复的次数
5. 生成一定范围内的整数随机数
其实我不知道哪一个函数可以,就用了好几个
> as.integer(runif(5,2.3,9.56)+0.5)
as.integer(x) : 将变量x下取整
runif(times, lower_bound,upper_bound) : times是产生的随机数的个数,lower_bound是生成随机数的范围下界,upper_bound是生成随机数的范围上界
+0.5 : 因为as.integer()是下取整,+0.5保证四舍五入
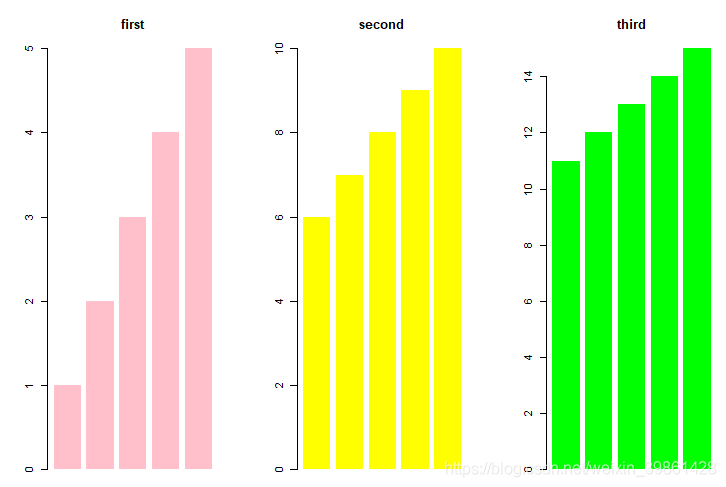
6. 画柱状图
> par(mfrow = c(1,3))
同时显示三个图
> barplot(a$first,col="pink",border = NA,main = "first")
> barplot(a$second,col="yellow",border = NA,main = "second")
> barplot(a$third,col="green",border = NA,main = "third")
barplot(x,col = , border = , main = ) : x是显示的内容,col是颜色,border是有无边框,main是主标题
7. 插入/ 删除dataframe中的列
先说删除
> a <- a[, -2]
  first third
1     1    11
2     2    12
3     3    13
4     4    14
5     5    15
-2 是指删除第二列
同理若要删除第二行,则是a[-2, ]
再说插入
> second <- c(6:10)
> a <- cbind(first=a[,1:1],second,third=a[,2:ncol(a)])
其实就是把要插入的位置之前的部分、要插入的部分、要插入的位置之后的部分用cbind( ) 组合起来
