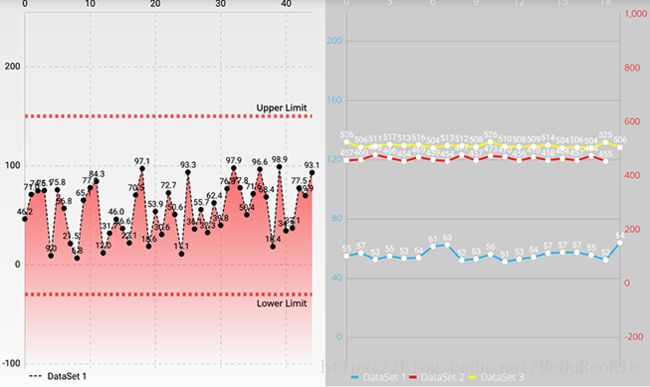
MPAndroidChart库绘制图表单条/多条曲线图
绘制一个简单的 LineChart
实例化 LineChart 对象,设置触摸相关设置
...
mChart.setOnChartGestureListener(this);
        mChart.setOnChartValueSelectedListener(this);
        mChart.setDrawGridBackground(false);

        // no description text
        mChart.getDescription().setEnabled(false);

        // enable touch gestures
        mChart.setTouchEnabled(true);

        // enable scaling and dragging
        mChart.setDragEnabled(true);
        mChart.setScaleEnabled(true);
        // mChart.setScaleXEnabled(true);
        // mChart.setScaleYEnabled(true);

        // if disabled, scaling can be done on x- and y-axis separately
        mChart.setPinchZoom(true);

        // set an alternative background color
        // mChart.setBackgroundColor(Color.GRAY);
        ...
添加一个自定义的标记视图(markerView)给图表
// create a custom MarkerView (extend MarkerView) and specify the layout
        // to use for it
        MyMarkerView mv = new MyMarkerView(this, R.layout.custom_marker_view);
        mv.setChartView(mChart); // For bounds control
        mChart.setMarker(mv); // Set the marker to the chart
设置x轴网格线样式
XAxis xAxis = mChart.getXAxis();
        xAxis.enableGridDashedLine(10f, 10f, 0f);
给轴添加极限值范围
 Typeface tf = Typeface.createFromAsset(getAssets(), "OpenSans-Regular.ttf");

        LimitLine ll1 = new LimitLine(150f, "Upper Limit");
        ll1.setLineWidth(4f);
        ll1.enableDashedLine(10f, 10f, 0f);
        ll1.setLabelPosition(LimitLabelPosition.RIGHT_TOP);
        ll1.setTextSize(10f);
        ll1.setTypeface(tf);

        LimitLine ll2 = new LimitLine(-30f, "Lower Limit");
        ll2.setLineWidth(4f);
        ll2.enableDashedLine(10f, 10f, 0f);
        ll2.setLabelPosition(LimitLabelPosition.RIGHT_BOTTOM);
        ll2.setTextSize(10f);
        ll2.setTypeface(tf);

        YAxis leftAxis = mChart.getAxisLeft();
        leftAxis.removeAllLimitLines(); // reset all limit lines to avoid overlapping lines
        leftAxis.addLimitLine(ll1);
        leftAxis.addLimitLine(ll2);
        leftAxis.setAxisMaximum(200f);
        leftAxis.setAxisMinimum(-50f);
        //leftAxis.setYOffset(20f);
        leftAxis.enableGridDashedLine(10f, 10f, 0f);
        leftAxis.setDrawZeroLine(false);

        // limit lines are drawn behind data (and not on top)
        leftAxis.setDrawLimitLinesBehindData(true);

        mChart.getAxisRight().setEnabled(false);
        // 添加动效
        mChart.animateX(2500);
        //mChart.invalidate();

        // 设置标签线段样式显示
        // get the legend (only possible after setting data)
        Legend l = mChart.getLegend();

        // modify the legend ...
        l.setForm(LegendForm.LINE);
添加数据
private void setData(int count, float range) {

        ArrayList values = new ArrayList();

        for (int i = 0; i < count; i++) {

            float val = (float) (Math.random() * range) + 3;
            values.add(new Entry(i, val, getResources().getDrawable(R.drawable.star)));
        }

        LineDataSet set1;

        if (mChart.getData() != null &&
                mChart.getData().getDataSetCount() > 0) {
            set1 = (LineDataSet)mChart.getData().getDataSetByIndex(0);
            set1.setValues(values);
            mChart.getData().notifyDataChanged();
            mChart.notifyDataSetChanged();
        } else {
            // create a dataset and give it a type
            set1 = new LineDataSet(values, "DataSet 1");

            set1.setDrawIcons(false);

            // set the line to be drawn like this "- - - - - -"
            set1.enableDashedLine(10f, 5f, 0f);
            set1.enableDashedHighlightLine(10f, 5f, 0f);
            set1.setColor(Color.BLACK);
            set1.setCircleColor(Color.BLACK);
            set1.setLineWidth(1f);
            set1.setCircleRadius(3f);
            set1.setDrawCircleHole(false);
            set1.setValueTextSize(9f);
            set1.setDrawFilled(true);
            set1.setFormLineWidth(1f);
            set1.setFormLineDashEffect(new DashPathEffect(new float[]{10f, 5f}, 0f));
            set1.setFormSize(15.f);

            if (Utils.getSDKInt() >= 18) {
                // fill drawable only supported on api level 18 and above
                Drawable drawable = ContextCompat.getDrawable(this, R.drawable.fade_red);
                set1.setFillDrawable(drawable);
            }
            else {
                set1.setFillColor(Color.BLACK);
            }

            ArrayList dataSets = new ArrayList();
            dataSets.add(set1); // add the datasets

            // create a data object with the datasets
            LineData data = new LineData(dataSets);

            // set data
            mChart.setData(data);
        }
    }
绘制多条线的 LineChart
LineChart 的设置
mChart = findViewById(R.id.chart1);
        mChart.setOnChartValueSelectedListener(this);

        // no description text
        mChart.getDescription().setEnabled(false);

        // enable touch gestures
        mChart.setTouchEnabled(true);

        mChart.setDragDecelerationFrictionCoef(0.9f);

        // enable scaling and dragging
        mChart.setDragEnabled(true);
        mChart.setScaleEnabled(true);
        mChart.setDrawGridBackground(false);
        mChart.setHighlightPerDragEnabled(true);

        // if disabled, scaling can be done on x- and y-axis separately
        mChart.setPinchZoom(true);

        // set an alternative background color
        mChart.setBackgroundColor(Color.LTGRAY);
标签设置(位置、文字属性等)
// get the legend (only possible after setting data)
        Legend l = mChart.getLegend();

        // modify the legend ...
        l.setForm(LegendForm.LINE);
        l.setTypeface(mTfLight);
        l.setTextSize(11f);
        l.setTextColor(Color.WHITE);
        l.setVerticalAlignment(Legend.LegendVerticalAlignment.BOTTOM);
        l.setHorizontalAlignment(Legend.LegendHorizontalAlignment.LEFT);
        l.setOrientation(Legend.LegendOrientation.HORIZONTAL);
        l.setDrawInside(false);
x轴y轴的设置
XAxis xAxis = mChart.getXAxis();
        xAxis.setTypeface(mTfLight);
        xAxis.setTextSize(11f);
        xAxis.setTextColor(Color.WHITE);
        xAxis.setDrawGridLines(false);
        xAxis.setDrawAxisLine(false);

        YAxis leftAxis = mChart.getAxisLeft();
        leftAxis.setTypeface(mTfLight);
        leftAxis.setTextColor(ColorTemplate.getHoloBlue());
        leftAxis.setAxisMaximum(200f);
        leftAxis.setAxisMinimum(0f);
        leftAxis.setDrawGridLines(true);
        leftAxis.setGranularityEnabled(true);

        YAxis rightAxis = mChart.getAxisRight();
        rightAxis.setTypeface(mTfLight);
        rightAxis.setTextColor(Color.RED);
        rightAxis.setAxisMaximum(900);
        rightAxis.setAxisMinimum(-200);
        rightAxis.setDrawGridLines(false);
        rightAxis.setDrawZeroLine(false);
        rightAxis.setGranularityEnabled(false);
添加数据给多条线的 LineChart
ArrayList yVals1 = new ArrayList();

        for (int i = 0; i < count; i++) {
            float mult = range / 2f;
            float val = (float) (Math.random() * mult) + 50;
            yVals1.add(new Entry(i, val));
        }

        ArrayList yVals2 = new ArrayList();

        for (int i = 0; i < count-1; i++) {
            float mult = range;
            float val = (float) (Math.random() * mult) + 450;
            yVals2.add(new Entry(i, val));
//            if(i == 10) {
//                yVals2.add(new Entry(i, val + 50));
//            }
        }

        ArrayList yVals3 = new ArrayList();

        for (int i = 0; i < count; i++) {
            float mult = range;
            float val = (float) (Math.random() * mult) + 500;
            yVals3.add(new Entry(i, val));
        }

        LineDataSet set1, set2, set3;

        if (mChart.getData() != null &&
                mChart.getData().getDataSetCount() > 0) {
            set1 = (LineDataSet) mChart.getData().getDataSetByIndex(0);
            set2 = (LineDataSet) mChart.getData().getDataSetByIndex(1);
            set3 = (LineDataSet) mChart.getData().getDataSetByIndex(2);
            set1.setValues(yVals1);
            set2.setValues(yVals2);
            set3.setValues(yVals3);
            mChart.getData().notifyDataChanged();
            mChart.notifyDataSetChanged();
        } else {
            // create a dataset and give it a type
            set1 = new LineDataSet(yVals1, "DataSet 1");

            set1.setAxisDependency(AxisDependency.LEFT);
            set1.setColor(ColorTemplate.getHoloBlue());
            set1.setCircleColor(Color.WHITE);
            set1.setLineWidth(2f);
            set1.setCircleRadius(3f);
            set1.setFillAlpha(65);
            set1.setFillColor(ColorTemplate.getHoloBlue());
            set1.setHighLightColor(Color.rgb(244, 117, 117));
            set1.setDrawCircleHole(false);
            //set1.setFillFormatter(new MyFillFormatter(0f));
            //set1.setDrawHorizontalHighlightIndicator(false);
            //set1.setVisible(false);
            //set1.setCircleHoleColor(Color.WHITE);

            // create a dataset and give it a type
            set2 = new LineDataSet(yVals2, "DataSet 2");
            set2.setAxisDependency(AxisDependency.RIGHT);
            set2.setColor(Color.RED);
            set2.setCircleColor(Color.WHITE);
            set2.setLineWidth(2f);
            set2.setCircleRadius(3f);
            set2.setFillAlpha(65);
            set2.setFillColor(Color.RED);
            set2.setDrawCircleHole(false);
            set2.setHighLightColor(Color.rgb(244, 117, 117));
            //set2.setFillFormatter(new MyFillFormatter(900f));

            set3 = new LineDataSet(yVals3, "DataSet 3");
            set3.setAxisDependency(AxisDependency.RIGHT);
            set3.setColor(Color.YELLOW);
            set3.setCircleColor(Color.WHITE);
            set3.setLineWidth(2f);
            set3.setCircleRadius(3f);
            set3.setFillAlpha(65);
            set3.setFillColor(ColorTemplate.colorWithAlpha(Color.YELLOW, 200));
            set3.setDrawCircleHole(false);
            set3.setHighLightColor(Color.rgb(244, 117, 117));

            // create a data object with the datasets
            LineData data = new LineData(set1, set2, set3);
            data.setValueTextColor(Color.WHITE);
            data.setValueTextSize(9f);

            // set data
            mChart.setData(data);
每个 LineDataSet 对象代表一条线,然后把所有存有数据的 LineDataSet 添加到 LineData,最终把 LineData 设置给 LineChart 图表对象。
更多信息可查看官方文档
https://github.com/PhilJay/MPAndroidChart/wiki
文章只是作为个人记录学习使用,如有不妥之处请指正,谢谢。
