安卓自定义View雷达图(蜘蛛图)教程
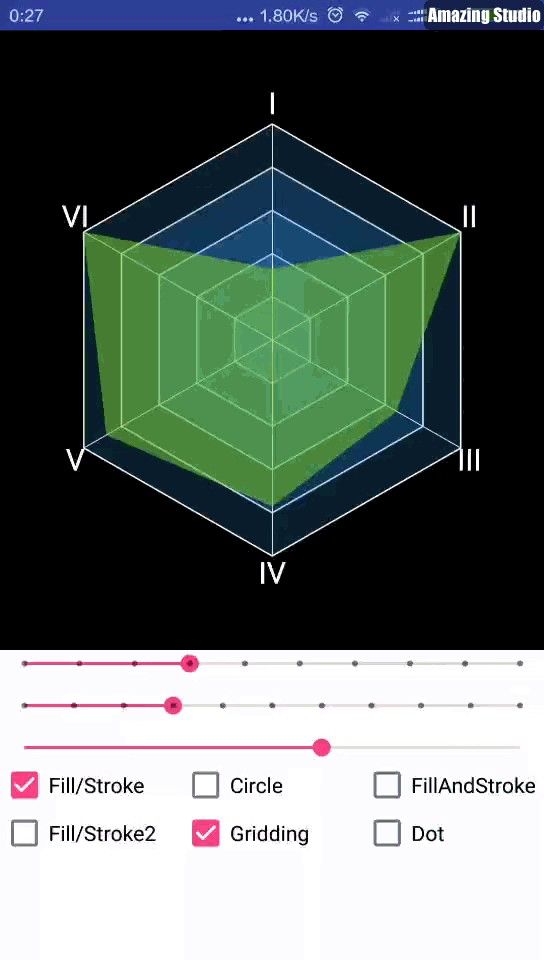
最近花点时间写了个自定义View雷达图,或者也叫玫瑰图或者蜘蛛图,分享给大家。效果如下:
ps:有时间我写详细一些
具体的源代码可以查看:https://github.com/SaltedFishHan/FreeRadarChartView
下面是代码
1、首先创建各种paint
 private void initPaint() {
        //网格竖线
        axisPaint = creatPaint(griddingColor, 0, 2, 0);

        //数据区域填充
        valuePaint = creatPaint(dataAreaColor, 1, 2, 0);

        //数据区域描边
        valueStrokePaint = creatPaint(valueStrokeColor, 0, 3, 0);

        //字体标签
        textPaint = creatPaint(textColor, 2, 0.5F, textSize);

        //点
        dotPaint = creatPaint(dotColor, 2, 1, 0);
//
        //网格横线填充
        fillPaint = creatPaint(bgColor, 1, 2, 0);

        //网格横线描边
        strokePaint = creatPaint(griddingColor, 0, 3, 0);
    }
2、接着绘制网格
/**
     * 绘制网格
     */
    private void drawGridding(Canvas canvas) {
        float r = radius / countY;
        for (int i = 1; i < countY + 1; i++) {
            float eachR = r * i;
            this.path.reset();
            for (int j = 0; j < countX; j++) {//
                float x = (float) (eachR * Math.cos(-Math.PI / 2 + angle * j));//-pi/2,是因为第一条线以正Y轴开始
                float y = (float) (eachR * Math.sin(-Math.PI / 2 + angle * j));
                if (i == countY) {
                    src.lineTo(x, y);
                    canvas.drawPath(src, axisPaint);
                    src.reset();
                }

                if (isCircle) {
                    float radius = (float) Math.sqrt(Math.pow(x, 2) + Math.pow(y, 2));
                    path.addCircle(0, 0, radius, Path.Direction.CW);
                } else {
                    if (j == 0) {
                        this.path.moveTo(x, y);
                    } else {
                        this.path.lineTo(x, y);
                    }
                }
            }
            this.path.close();
            canvas.drawPath(this.path, fillPaint);
            if (griddingVisiable) {
                canvas.drawPath(this.path, strokePaint);
            }
        }
    }
3、绘制外围罗马字的标签
 /**
     * 外围标签
     */
    private void drawText(Canvas canvas) {
        Iterator> iterator = valueHash.entrySet().iterator();
        Paint.FontMetrics fontMetrics = textPaint.getFontMetrics();
        float fontHeight = fontMetrics.descent - fontMetrics.ascent;
        float r = radius * (countX - 1) / countX;//半径大小
        for (int i = 0; i < countX; i++) {
            Map.Entry next = iterator.next();
            float x = (float) ((textSpacing + radius) * Math.cos(-Math.PI / 2 + angle * i));
            float y = (float) ((textSpacing + radius) * Math.sin(-Math.PI / 2 + angle * i));

            double angle2 = angle * i;
            float height = fontHeight / 2;//文本高度一半
            if (angle2 >= 0 && angle2 <= Math.PI / 2) {//第1象限//
                float dis = textPaint.measureText(next.getKey()) / 2;//文本长度一半
                canvas.drawText(next.getKey(), x - dis, y, textPaint);
            } else if (angle2 > Math.PI / 2 && angle2 <= Math.PI) {//第2象限
                float dis = textPaint.measureText(next.getKey()) / 2;//文本长度一半
                canvas.drawText(next.getKey(), x - dis, y + height, textPaint);
            } else if (angle2 >= Math.PI && angle2 < 3 * Math.PI / 2) {//第3象限
                float dis = textPaint.measureText(next.getKey()) / 2;//文本长度一半
                canvas.drawText(next.getKey(), x - dis, y + height, textPaint);
            } else if (angle2 >= 3 * Math.PI / 2 && angle2 <= Math.PI * 2) {//第4象限
                float dis = textPaint.measureText(next.getKey()) / 2;//文本长度一半
                canvas.drawText(next.getKey(), x - dis, y, textPaint);
            }
        }
    }
4、绘制数据区域的图形,绿色部分:
/**
     * 绘制数据区域图形
     */
    private void drawData(Canvas canvas) {
        Iterator> iterator = valueHash.entrySet().iterator();
        Path dataPath = new Path();
        float r = radius / axisMax;//半径大小
        for (int i = 0; i < countX; i++) {
            Map.Entry next = iterator.next();
            float x = (float) Math.cos(-Math.PI / 2 + angle * i) * r * next.getValue();
            float y = (float) Math.sin(-Math.PI / 2 + angle * i) * r * next.getValue();
            if (i == 0) {
                dataPath.moveTo(x, y);//
            } else {
                dataPath.lineTo(x, y);
            }
            if (dotVisiable) {
                canvas.drawCircle(x, y, dotRadius, dotPaint);
            }
        }
        dataPath.close();
        canvas.drawPath(dataPath, valuePaint);
        if (fillAndStrock) {
            canvas.drawPath(dataPath, valueStrokePaint);
        }
} 主要的绘制代码就是这些。具体的源代码可以查看:https://github.com/SaltedFishHan/FreeRadarChartView
如果喜欢,欢迎Star~
