Datawhale零基础入门NLP赛事——新闻文本分类Task2
数据读取与数据分析
使用pandas读取文件
train_df=pd.read_csv('./data/train_set.csv',sep='\t',nrows=10)
print(train_df.head()) 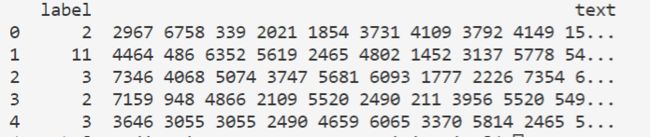
句子长度统计
train_df['text_len']=train_df['text'].apply(lambda x: len(x.split(' '))) #x为每个句子
print(train_df['text_len'])
print(train_df['text_len'].describe())
服务器上使用matplotlib.pyplot绘图
import matplotlib as mpl
mpl.use('Agg')
import matplotlib.pyplot as plt
plt.savefig("/home/yourname/test.jpg") 新闻类别分布
train_df['label'].value_counts().plot(kind='bar')
plt.xlabel('category')
plt.title('News class count')
plt.savefig("./class_count.jpg") 
字符分布统计
all_lines=' '.join(list(train_df['text']))
word_count=Counter(all_lines.split(" "))
word_count=sorted(word_count.items(), key=lambda x: x[1],reverse=True)
print(len(word_count))  #训练集中总字数
print(word_count[0])  #出现次数最多的字
6709
('3750', 5443908)寻找标点符号
train_df['text_unique']=train_df['text'].apply(lambda x:' '.join(list(set(x.split(' ')))))
#把每个句子中的词去重,然后拼接起来
all_lines=' '.join(list(train_df['text_unique']))  #把所有句子拼接起来
word_count=Counter(all_lines.split(' ')) #统计次数
word_count=sorted(word_count.items(), key=lambda x: x[1],reverse=True) #降序排序
print(word_count[0])
('3750', 165819)作业
- 设字符3750,字符900和字符648是句子的标点符号,请分析赛题每篇新闻平均由多少个句子构成
寻找每篇新闻中,字符3750,900,648出现次数,有多少标点就有多少句子
- 统计每类新闻中出现次数最多的字符
按照label分组,然后把每组新闻拼接起来,统计字符
DataFrame中的统计函数
直接上例子:
df = pd.DataFrame({"Person":
...                    ["John", "Myla", "Lewis", "John", "Myla"],
...                    "Age": [24., np.nan, 21., 33, 26],
...                    "Single": [False, True, True, True, False]})
>>> df

   Person   Age  Single
0    John  24.0   False
1    Myla   NaN    True
2   Lewis  21.0    True
3    John  33.0    True
4    Myla  26.0   False
count()函数:统计一个数列中非NA元素的个数
>>> df.count()

Person    5
Age       4
Single    5
dtype: int64
>>df.count(axis='columns') #按列,axis=0
0 3
1 2
2 3
3 3
4 3
dtype: int64分组统计:
df.groupby('Person').sum()分组与聚合
https://www.jianshu.com/p/4345878fb316 python数据分析