1.产生异常值的原因
2.异常值检测/删除算法
a.训练所有的数据
b.去除错误的点,一般占10%
c.对当前减小后的数据集在进行训练
3.迷你项目
此项目有两部分。在第一部分中将运行回归,然后识别并删除具有最大残差的 10% 的点。然后,根据 Sebastian 在课程视频中所建议的,从数据集中删除那些异常值并重新拟合回归。
在第二部分中,你将熟悉安然财务数据中的一些异常值,并且了解是否/如何删除它们。
带有异常值的回归斜率
Sebastian 向我们描述了改善回归的一个算法,你将在此项目中实现该算法。你将在接下来的几个测试题中运用这一算法。总的来说,你将在所有训练点上拟合回归。舍弃在实际 y 值和回归预测 y 值之间有最大误差的 10% 的点。
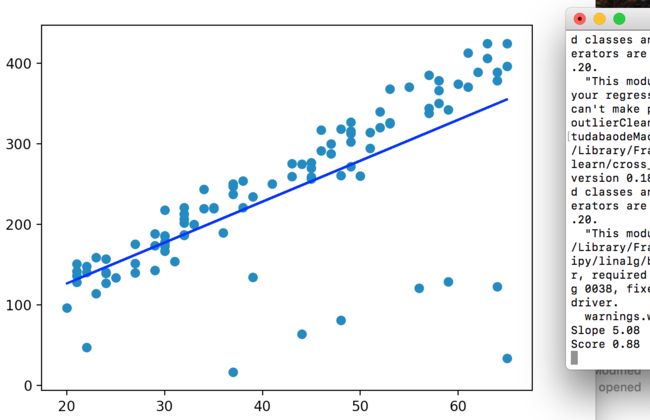
先开始运行初始代码 (outliers/outlier_removal_regression.py) 和可视化点。一些异常值应该会跳出来。部署一个线性回归,其中的净值是目标,而用来进行预测的特征是人的年龄(记得在训练数据上进行训练!)。
数据点主体的正确斜率是 6.25(我们之所以知道,是因为我们使用该值来生成数据);你的回归的斜率是多少?
#!/usr/bin/python

import random
import numpy
import matplotlib.pyplot as plt
import pickle

from outlier_cleaner import outlierCleaner


### load up some practice data with outliers in it
ages = pickle.load( open("practice_outliers_ages.pkl", "r") )
net_worths = pickle.load( open("practice_outliers_net_worths.pkl", "r") )


### ages and net_worths need to be reshaped into 2D numpy arrays
### second argument of reshape command is a tuple of integers: (n_rows, n_columns)
### by convention, n_rows is the number of data points
### and n_columns is the number of features
ages       = numpy.reshape( numpy.array(ages), (len(ages), 1))
net_worths = numpy.reshape( numpy.array(net_worths), (len(net_worths), 1))
from sklearn.cross_validation import train_test_split
ages_train, ages_test, net_worths_train, net_worths_test = train_test_split(ages, net_worths, test_size=0.1, random_state=42)

### fill in a regression here!  Name the regression object reg so that
### the plotting code below works, and you can see what your regression looks like


from sklearn.linear_model import LinearRegression
reg = LinearRegression()
reg.fit(ages_train,net_worths_train)
y_pred = reg.predict(ages_test)
print 'Slope %.2f' % reg.coef_
print 'Score %.2f' % reg.score(ages_test,net_worths_test)


try:
    plt.plot(ages, reg.predict(ages), color="blue")
except NameError:
    pass
plt.scatter(ages, net_worths)
plt.show()


### identify and remove the most outlier-y points
cleaned_data = []
try:
    predictions = reg.predict(ages_train)
    cleaned_data = outlierCleaner( predictions, ages_train, net_worths_train )
except NameError:
    print "your regression object doesn't exist, or isn't name reg"
    print "can't make predictions to use in identifying outliers"


### only run this code if cleaned_data is returning data
if len(cleaned_data) > 0:
    ages, net_worths, errors = zip(*cleaned_data)
    ages       = numpy.reshape( numpy.array(ages), (len(ages), 1))
    net_worths = numpy.reshape( numpy.array(net_worths), (len(net_worths), 1))

    ### refit your cleaned data!
    try:
        reg.fit(ages, net_worths)
        plt.plot(ages, reg.predict(ages), color="blue")
    except NameError:
        print "you don't seem to have regression imported/created,"
        print "   or else your regression object isn't named reg"
        print "   either way, only draw the scatter plot of the cleaned data"
    plt.scatter(ages, net_worths)
    plt.xlabel("ages")
    plt.ylabel("net worths")
    plt.show()


else:
    print "outlierCleaner() is returning an empty list, no refitting to be done"
清理后的斜率
你将在 outliers/outlier_cleaner.py 中找到 outlierCleaner() 函数的骨架并向其填充清理算法。用到的三个参数是:predictions 是一个列表,包含回归的预测目标;ages 也是一个列表,包含训练集内的年龄;net_worths 是训练集内净值的实际值。每个列表中应有 90 个元素(因为训练集内有 90 个点)。你的工作是返回一个名叫cleaned_data 的列表,该列表中只有 81 个元素,也即预测值和实际值 (net_worths) 具有最小误差的 81 个训练点 (90 * 0.9 = 81)。cleaned_data 的格式应为一个元组列表,其中每个元组的形式均为 (age, net_worth, error)。
一旦此清理函数运行起来,你应该能看到回归结果发生了变化。新斜率是多少?是否更为接近 6.25 这个“正确”结果?

