Matplotlib学习(四)多图合并显示 && 动画Animation
原文地址 https://morvanzhou.github.io/tutorials/data-manipulation/plt/5-1-animation/
(一)Subplot多合一显示
example 1: 简单的均匀图 example 2: 不均匀图中图


example 1 代码:
import matplotlib.pyplot as plt

plt.figure(figsize=(6, 4))
# plt.subplot(n_rows, n_cols, plot_num)
plt.subplot(2, 2, 1)
plt.plot([0, 1], [0, 1])

plt.subplot(222)
plt.plot([0, 1], [0, 2])

plt.subplot(223)
plt.plot([0, 1], [0, 3])

plt.subplot(224)
plt.plot([0, 1], [0, 4])

#tight_layout会自动调整子图参数,使之填充整个图像区域。
plt.tight_layout()
plt.show()
example 2 代码:将画布划分为两行三列,第一个图占据第一行的三列,之后三个图占据第二行
import matplotlib.pyplot as plt

plt.figure(figsize=(6, 4))
# plt.subplot(n_rows, n_cols, plot_num)
plt.subplot(2, 1, 1)
# figure splits into 2 rows, 1 col, plot to the 1st sub-fig
plt.plot([0, 1], [0, 1])

plt.subplot(234)
# figure splits into 2 rows, 3 col, plot to the 4th sub-fig
plt.plot([0, 1], [0, 2])

plt.subplot(235)
# figure splits into 2 rows, 3 col, plot to the 5th sub-fig
plt.plot([0, 1], [0, 3])

plt.subplot(236)
# figure splits into 2 rows, 3 col, plot to the 6th sub-fig
plt.plot([0, 1], [0, 4])


plt.tight_layout()
plt.show()
(二)Subplot 分格显示
三种方法绘制:
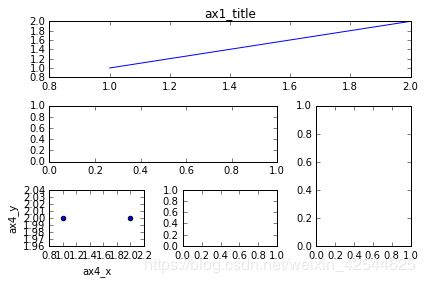
①subplot2grid:(3,3)表示将整个图像窗口分成3行3列, (0,0)表示从第0行第0列开始作图,colspan=3表示列的跨度为3, rowspan=1表示行的跨度为1. colspan和rowspan缺省, 默认跨度为1。
使用plt.subplot2grid来创建第2个小图, (3,3)表示将整个图像窗口分成3行3列, (1,0)表示从第1行第0列开始作图,colspan=2表示列的跨度为2. 同上画出 ax3, (1,2)表示从第1行第2列开始作图,rowspan=2表示行的跨度为2. 再画一个 ax4 和 ax5, 使用默认 colspan, rowspan.
使用ax4.scatter创建一个散点图, 使用ax4.set_xlabel和ax4.set_ylabel来对x轴和y轴命名.

②gridspec:需要使用import导入matplotlib.gridspec, 并简写成gridspec.
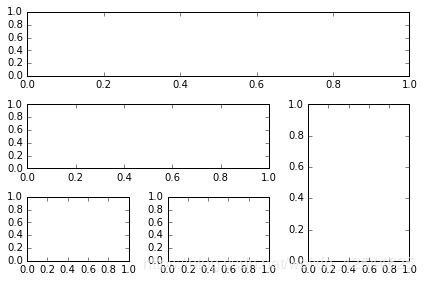
使用gridspec.GridSpec将整个图像窗口分成3行3列,基于索引的方法创建小图位置。
使用plt.subplot来作图, gs[0, :]表示这个图占第0行和所有列, gs[1, :2]表示这个图占第1行和第2列前的所有列, gs[1:, 2]表示这个图占第1行后的所有行和第2列, gs[-1, 0]表示这个图占倒数第1行和第0列, gs[-1, -2]表示这个图占倒数第1行和倒数第2列.

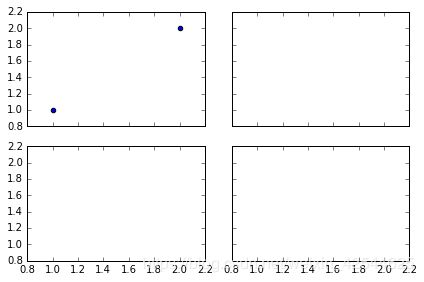
③subplots:使用plt.subplots建立一个2行2列的图像窗口,sharex=True表示共享x轴坐标, sharey=True表示共享y轴坐标. ((ax11, ax12), (ax13, ax14))表示第1行从左至右依次放ax11和ax12, 第2行从左至右依次放ax13和ax14.

import matplotlib.pyplot as plt
import matplotlib.gridspec as gridspec

# method 1: subplot2grid
##########################
plt.figure()
ax1 = plt.subplot2grid((3, 3), (0, 0), colspan=3)  # stands for axes
ax1.plot([1, 2], [1, 2])
ax1.set_title('ax1_title')
ax2 = plt.subplot2grid((3, 3), (1, 0), colspan=2)
ax3 = plt.subplot2grid((3, 3), (1, 2), rowspan=2)
ax4 = plt.subplot2grid((3, 3), (2, 0))
ax4.scatter([1, 2], [2, 2])
ax4.set_xlabel('ax4_x')
ax4.set_ylabel('ax4_y')
ax5 = plt.subplot2grid((3, 3), (2, 1))

# method 2: gridspec
#########################
plt.figure()
gs = gridspec.GridSpec(3, 3)
# use index from 0
ax6 = plt.subplot(gs[0, :])
ax7 = plt.subplot(gs[1, :2])
ax8 = plt.subplot(gs[1:, 2])
ax9 = plt.subplot(gs[-1, 0])
ax10 = plt.subplot(gs[-1, -2])

# method 3: easy to define structure
####################################
f, ((ax11, ax12), (ax13, ax14)) = plt.subplots(2, 2, sharex=True, sharey=True)
ax11.scatter([1,2], [1,2])

plt.tight_layout()
plt.show()
import matplotlib.pyplot as plt

fig = plt.figure()
x = [1, 2, 3, 4, 5, 6, 7]
y = [1, 3, 4, 2, 5, 8, 6]

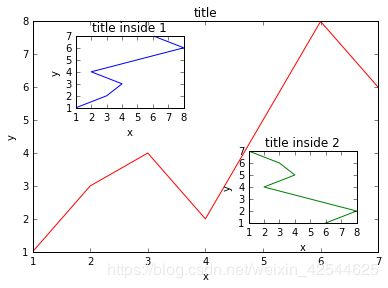
# below are all percentage # 4个值都是占整个figure坐标系的百分比。
left, bottom, width, height = 0.1, 0.1, 0.8, 0.8
ax1 = fig.add_axes([left, bottom, width, height])  # main axes
ax1.plot(x, y, 'r')
ax1.set_xlabel('x')
ax1.set_ylabel('y')
ax1.set_title('title')

# 左上角小图1
ax2 = fig.add_axes([0.2, 0.6, 0.25, 0.25])  # inside axes
ax2.plot(y, x, 'b')
ax2.set_xlabel('x')
ax2.set_ylabel('y')
ax2.set_title('title inside 1')

#右下角小图2
# different method to add axes
####################################
plt.axes([0.6, 0.2, 0.25, 0.25])
plt.plot(y[::-1], x, 'g')
plt.xlabel('x')
plt.ylabel('y')
plt.title('title inside 2')

plt.show()
(四)次坐标轴

关键的一步是:ax2 = ax1.twinx() # mirror the ax1
import matplotlib.pyplot as plt
import numpy as np

x = np.arange(0, 10, 0.1)
y1 = 0.05 * x**2
y2 = -1 *y1

fig, ax1 = plt.subplots()

ax2 = ax1.twinx()    # mirror the ax1
ax1.plot(x, y1, 'g-')
ax2.plot(x, y2, 'b-')

ax1.set_xlabel('X data')
ax1.set_ylabel('Y1 data', color='g')
ax2.set_ylabel('Y2 data', color='b')

plt.show()
(五)Animation动画
我们的数据是一个0~2π内的正弦曲线。接着,构造自定义动画函数animate,用来更新每一帧上各个x对应的y坐标值,参数表示第i帧;以及构造开始帧函数init;
def animate(i):
    line.set_ydata(np.sin(x + i/10.0))  # update the data
    return line,


# Init only required for blitting to give a clean slate.
def init():
    line.set_ydata(np.sin(x))
    return line,
接下来,我们调用FuncAnimation函数生成动画。参数说明:
fig 进行动画绘制的figure
func 自定义动画函数,即传入刚定义的函数animate
frames 动画长度,一次循环包含的帧数
init_func 自定义开始帧,即传入刚定义的函数init
interval 更新频率,以ms计
blit 选择更新所有点,还是仅更新产生变化的点。应选择True,但mac用户请选择False,否则无法显示动画
ani = animation.FuncAnimation(fig=fig,
                              func=animate,
                              frames=100,
                              init_func=init,
                              interval=20,
                              blit=False)
当然,你也可以将动画以mp4格式保存下来,但首先要保证你已经安装了ffmpeg 或者mencoder, 更多信息参考matplotlib animation api:
ani.save('basic_animation.mp4', fps=30, extra_args=['-vcodec', 'libx264'])
完整代码如下:
import numpy as np
from matplotlib import pyplot as plt
from matplotlib import animation

fig, ax = plt.subplots()

x = np.arange(0, 2*np.pi, 0.01)
line, = ax.plot(x, np.sin(x))


def animate(i):
    line.set_ydata(np.sin(x + i/10.0))  # update the data
    return line,


# Init only required for blitting to give a clean slate.
def init():
    line.set_ydata(np.sin(x))
    return line,

# call the animator.  blit=True means only re-draw the parts that have changed.
# blit=True dose not work on Mac, set blit=False
# interval= update frequency
ani = animation.FuncAnimation(fig=fig, func=animate, frames=100, init_func=init,
                              interval=20, blit=False)

# save the animation as an mp4.  This requires ffmpeg or mencoder to be
# installed.  The extra_args ensure that the x264 codec is used, so that
# the video can be embedded in html5.  You may need to adjust this for
# your system: for more information, see
# http://matplotlib.sourceforge.net/api/animation_api.html
# anim.save('basic_animation.mp4', fps=30, extra_args=['-vcodec', 'libx264'])

plt.show()
