决策树算法的可视化表达
这一篇接着上一篇博客,由于字典这种数据结构的不清晰性,失去了决策树算法本身的优点,所以我们需要将结果通过树形图来表示出来,采用的是Python中matplotlib库。
首先我们简单测试一下使用matplotlib库来画标注的效果。
import matplotlib.pyplot as plt
decisionNode = dict(boxstyle = 'sawtooth',fc ="0.8" )    #定义树节点的一些特征
leafNode = dict(boxstyle='round4',fc="0.8")              #定义叶节点的一些特征
arrow_args = dict(arrowstyle='<-')                       #定义箭头的特征
def plotNode(nodeTxt,centerPt,parentPt,nodeType):
    createPlot.ax1.annotate(nodeTxt,xy=parentPt,xycoords='axes fraction',
                            xytext=centerPt,textcoords='axes fraction',va="center",
                            ha="center",bbox=nodeType,arrowprops=arrow_args)
                             #annotate参数说明:nodeTxt是标注内容,xy是标注终点的位置坐标,xytext是标注起点的位置坐标,arrowprops标注箭头属性信息

def createPlot():
    fig = plt.figure(1,facecolor='white')   生成一个图形,1是名字,facecolor是底色
    fig.clf()               #清除图像内容
    createPlot.ax1=plt.subplot(111,frameon=False)  #111代表生成几行几列第几个图的意思,例如223,就是生成一个两行两列的子图,你画的是其中的第三个,frameon表示子图是否显示坐标轴线,默认True显示,False不显示。
    plotNode('a decision node',(0.5,0.1),(0.1,0.5),decisionNode)#画树节点
    plotNode('a leaf node',(0.8,0.1),(0.3,0.8),leafNode)        #画叶节点
plt.show()下面就开始正式进入决策树可视化算法的部分,首先对于一棵树,我们需要知道他的深度和宽度,深度可以由树的层数来决定,因为决策树是一个完全n叉树,所以可以由总叶节点的个数来确定树的宽度。下面两个函数就分别计算了决策树的深度与宽度。
def getNumLeafs(myTree):      #计算叶节点数目(树的宽度),采用了递归调用的方法
    numLeafs = 0
    firstStr = myTree.keys()[0]
    secondDict = myTree[firstStr]
    for key in secondDict.keys():
        if type(secondDict[key]).__name__=='dict':
            numLeafs+=getNumLeafs(secondDict[key])
        else: numLeafs+=1
    return numLeafs
def getTreeDepth(myTree): #计算树的深度,同上采用了递归调用的方法
maxDepth = 0
firstStr = myTree.keys()[0]
secondDict = myTree[firstStr]
for key in secondDict.keys():
if type(secondDict[key]).__name__=='dict':#test to see if the nodes are dictonaires, if not they are leaf nodes
thisDepth = 1 + getTreeDepth(secondDict[key])
print(thisDepth)
else: thisDepth = 1
if thisDepth > maxDepth: maxDepth = thisDepth
return maxDepth该函数的作用是在父节点与子节点之间绘制信息。
def plotMidText(cntrPt, parentPt, txtString):#在父子节点之间绘制文本信息
    xMid = (parentPt[0]-cntrPt[0])/2.0 + cntrPt[0]
    yMid = (parentPt[1]-cntrPt[1])/2.0 + cntrPt[1]
    createPlot.ax1.text(xMid, yMid, txtString, va="center", ha="center", rotation=30)
该函数就是本算法中的主要部分,绘制树。主要思想在下文中有提及。
def plotTree(myTree, parentPt, nodeTxt):#if the first key tells you what feat was split on
    numLeafs = getNumLeafs(myTree)                    #叶节点个数,决定了x轴上的宽度
    depth = getTreeDepth(myTree)                      #树的深度,决定了y轴上的宽度
    firstStr = myTree.keys()[0]                       #根节点的标签
    cntrPt = (plotTree.xOff + (1.0 + float(numLeafs))/2.0/plotTree.totalW,
        plotTree.yOff)                                #见注释
    plotMidText(cntrPt, parentPt, nodeTxt)            #绘制父子节点之间的文本信息
    plotNode(firstStr, cntrPt, parentPt, decisionNode)#绘制树节点,firstStr是该点的标签值,cntrPt是子节点的位置坐标,parentPt是父节点位置坐标
    secondDict = myTree[firstStr]
    plotTree.yOff = plotTree.yOff - 1.0/plotTree.totalD#将跟踪点的y坐标向下移动一格
    for key in secondDict.keys():                      #遍历secondDict的取值
        if type(secondDict[key]).__name__=='dict':     #检查此处是不是dict,如果是则此处是树节点,若不是则此处是叶节点
            plotTree(secondDict[key],cntrPt,str(key))  #递归调用plotTree
        else:                                          #此处是叶节点,则画出叶节点
            plotTree.xOff = plotTree.xOff + 1.0/plotTree.totalW  #将x坐标向右移动一格
            plotNode(secondDict[key], (plotTree.xOff, plotTree.yOff), cntrPt, leafNode)                                      #画出此处的节点
            plotMidText((plotTree.xOff, plotTree.yOff), cntrPt, str(key))
    plotTree.yOff = plotTree.yOff + 1.0/plotTree.totalD#画出父子节点间的文本信息

def createPlot(inTree):
    fig = plt.figure(1, facecolor='white')
    fig.clf()
    axprops = dict(xticks=[], yticks=[])    #控制坐标的显示
    createPlot.ax1 = plt.subplot(111, frameon=False, **axprops)    #不显示坐标
    #createPlot.ax1 = plt.subplot(111, frameon=False)           #显示坐标
    plotTree.totalW = float(getNumLeafs(inTree))       #计算叶节点数目并赋给totalW
    plotTree.totalD = float(getTreeDepth(inTree))      #计算树的深度并赋给totalD
    plotTree.xOff = -0.5/plotTree.totalW; plotTree.yOff = 1.0;#给定xOff的初始值
    plotTree(inTree, (0.5,1.0), '')
    plt.show()
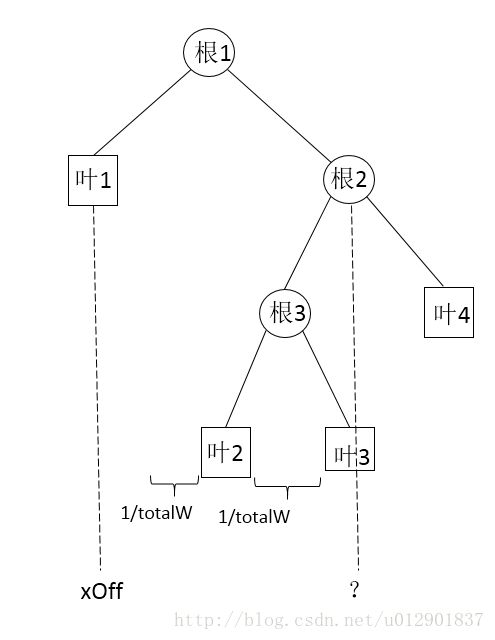
注释:在这里解释一下这个式子的由来,在下面列了两种情形,通过图解的方式来解释一下这个式子。

先来看这样一种情形,当我们画好叶节点1准备递归调用plotTree生成根节点2时,我们首先需要确定根节点2的坐标,从图上可以看出根节点2的横坐标与叶节点1的横坐标之间相差2.5个1/totalW,即目前(叶节点个数/2)/totalW + 0.5*(1/totalW),即根节点2的坐标为plotTree.xOff + (1.0 + float(numLeafs))/2.0/plotTree.totalW。
如果当前叶节点为奇数个,则为下面一种情形。

从图上可以看出根节点2的横坐标与叶节点1的横坐标之间相差2个1/totalW,即目前(叶节点个数/2)/totalW + 0.5*(1/totalW),即根节点2的坐标为plotTree.xOff + (1.0 + float(numLeafs))/2.0/plotTree.totalW。
决策树可视化算法的本质就是二叉树的实现,而且决策树本身是一个完全n叉树,首先计算出决策树的叶节点的数目(即决策树的宽度)和树的层数(即深度)。在画决策树的过程中采用两个变量xOff和yOff来跟踪当前位置,遇到树节点就递归调用plotTree函数,遇到叶节点就将xOff向右移一格并画出节点。
{‘no surfacing’: {0: ‘no’, 1: {‘flippers’: {0:{‘old’:{0: ‘no’,1: ‘yes’}} , 1: {‘new’:{0: ‘no’,1: ‘yes’}}}}}}
对于这样的一棵决策树,运行上面代码可以得到下图。

