Python利用Graphviz画图
Graphviz的是AT&T Labs Research开发的图形绘制工具软件。
Graphviz的是AT&T Labs Research开发的图形绘制工具,他可以很方便的用来绘制结构化的图形网络,支持多种格式输出,生成图片的质量和速度都不错.Graphviz本身是开源的产品,下载可以到 这里,以及他的演示界面 Graphviz在windows上和Linux上都可以顺利运行。
使用graphviz可以画流程图、状态图等,非常方便。
python画点边图基本代码:
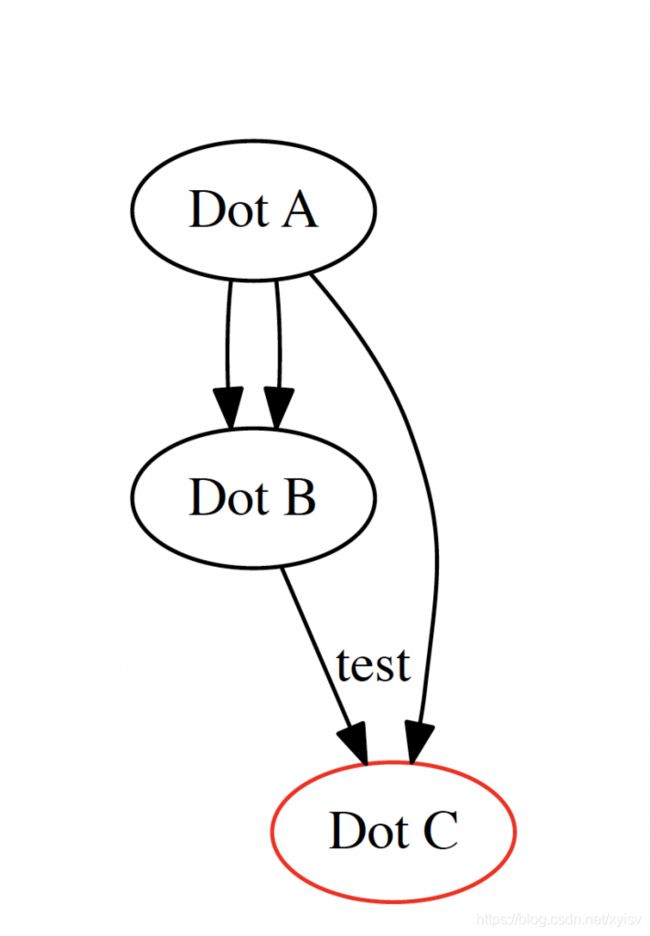
from graphviz import Digraph

dot = Digraph(comment='The Test Table')
# 添加圆点A,A的标签是Dot A
dot.node('A', 'Dot A')
# 添加圆点 B, B的标签是Dot B
dot.node('B', 'Dot B')
# dot.view()
# 添加圆点 C, C的标签是Dot C
dot.node(name='C', label= 'Dot C',color='red')
# dot.view()

# 创建一堆边,即连接AB的两条边,连接AC的一条边。
dot.edges(['AB', 'AC', 'AB'])
# dot.view()
# 在创建两圆点之间创建一条边
dot.edge('B', 'C', 'test')
# dot.view()

# 获取DOT source源码的字符串形式
print(dot.source)
dot.view()
dot.render('test-table.gv', view=True)
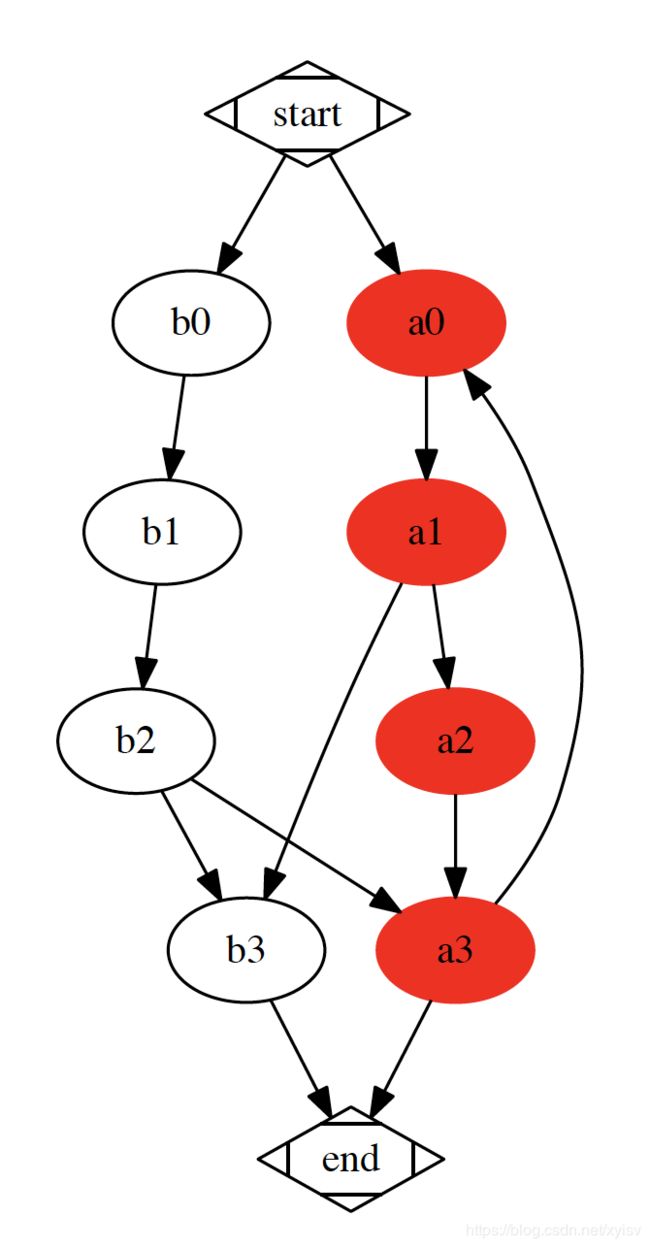
from graphviz import Digraph
grap_g = Digraph("G",format="pdf")


sub_g0 = Digraph(comment="process1",graph_attr={"style":'filled',"color":'lightgrey'},node_attr={"style":"filled","color":"red"})
sub_g0.node("a0","a0")
sub_g0.node("a1","a1")
sub_g0.node("a2","a2")
sub_g0.node("a3","a3")
sub_g0.edge("a0","a1")
sub_g0.edge("a1","a2")
sub_g0.edge("a2","a3")
sub_g0.edge("a3", "a0")

sub_g1 = Digraph(comment="process1",graph_attr={"style":'filled'})
sub_g1.node("B","b0")
sub_g1.node("C","b1")
sub_g1.node("D","b2")
sub_g1.node("E","b3")
sub_g1.edges(["BC","CD","DE"])

grap_g.node(
"start", label="start",shape="Mdiamond")
grap_g.node(
"end", label="end", shape="Mdiamond")

grap_g.subgraph(sub_g0)
grap_g.subgraph(sub_g1)
grap_g.edge("start","a0")
grap_g.edge("start","B")

grap_g.edge("a1","E")
grap_g.edge("D","a3")

grap_g.edge("a3","end")
grap_g.edge("E","end")

grap_g.render('test-table2.gv', view=True)

from graphviz import Digraph

g = Digraph('测试图片')
g.node(name='a',color='red')
g.node(name='b',color='blue')
g.edge('a','b',color='green')
g.view()

更多内容访问omegaxyz.com
网站所有代码采用Apache 2.0授权
网站文章采用知识共享许可协议BY-NC-SA4.0授权
© 2018 • OmegaXYZ-版权所有 转载请注明出处
