在开始之前先罗列一些概念(如果哪里有误请在评论中指出):
让我们先考虑一种情况,假如我们现在使用yolov2检测数据集中的小猫,我们知道这些数据集是打了标签的,即它是有ground truth的,正常情况下,预测结果会包含小猫的置信度和位置 ,将实例分成正类(positive)或负类(negative)[根据IOU,与置信度无关,置信度用于ap计算,不用于判断实例是TP还是什么],可以参考下图1

图1
- 取左上角的tp来说,其中的p是分类器认为的样本分类结果,本例中认为是该实例是正确的,接着我们拿着这个结果和ground truth标签作对比,认为上述分类是正确的,即为t,如果认为是错误的,则为f,实例结果就变成f了,样本分类结果就是fp。tn和fn以此类推。
- 另一种解释:
- TP:检测到的正确样例;它的IOU数值大于阈值
- FP:检测到的错误样例;它的IOU数值小于阈值
- FN:没检测到的正确样例
- TN:正确的样例但不在ground truth里的,比如一张图你识别出来了3只猫(假设这三只猫全部识别正确),但是打标签的时候只打了2只猫,那另外那只猫就叫做TN,这种样本是不计入AP计算的
PS:这里的阈值每种数据集要求不一样,voc2007要求IOU阈值为50%,COCO则要求在5%到95%范围内。
本文主要参考了该github项目:点我,如果想深入了解上述名词的含义,可以自己点击阅读。
Precison:
TP/(TP+FP)-------------->TP/(all detected things)
Recall:
TP/(TP+FN)-------------->TP/(ground truth中所有的正确实例)
AP:
这里主要讲一下上述github项目中有点难懂的地方:
-
项目中提到的voc数据集ap的两种计算方法分别是11点插值法和全局点插值,2010年以后都用全局点插值方法。其中关于11点插值法有点难懂,这里提一下:
我们假定检测了5张图片,其中groundtruth实例数目是15,实际检测出的实例数目是24,下图是24个实例列表,
我们分别取0,0.1,0.2,,,0.9,1.0这十一个点的插值计算AP。先根据实例列表图画出PR曲线,如下图: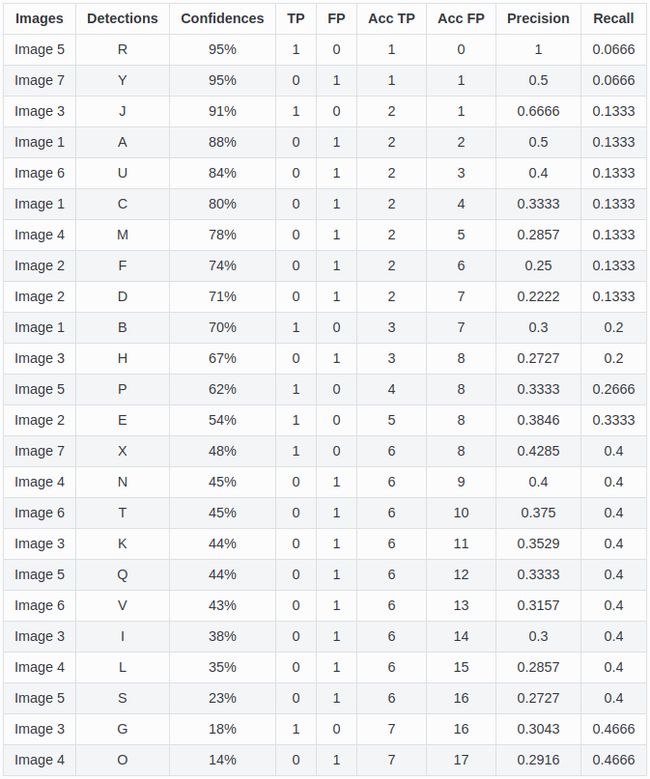 根据置信度排序的实例列表
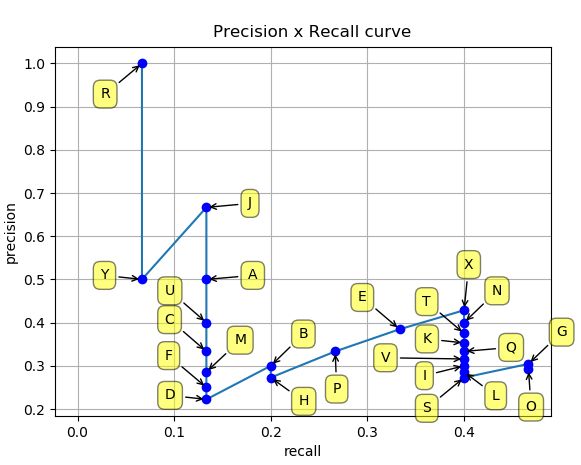 PR图
PR图每个插值点取值计算方法:取大于等于该插值点的所有recall值中的最大precision。例如,0.0插值点,其precision值为1.0;0.1插值点,其precision值为0.666;0.2插值点,为0.4285。而到了0.5插值点及以后,precision值均为0了。所以AP的数值即为:
 image.png
 image.png
 image.png
mAP:
上面计算的都是单类的AP数值,那么如果目标检测任务中除了检测猫,还要检测狗,鸡,鸭怎么办呢,这时候就用到mAP了,计算方法为其中的4指的是实例种数。
项目实践(计算mAP和PR曲线)
本文的实践代码均基于上述github代码,针对yolov3网络做了些修改。
- 首先在测试集上测试得到识别结果,yolov3会将识别结果存入txt文件,具体命令请参考上篇文章。
- 计算代码为:
###########################################################################################
#                                                                                         #
# This sample shows how to evaluate object detections applying the following metrics:     #
#  * Precision x Recall curve       ---->       used by VOC PASCAL 2012                   #
#  * Average Precision (AP)         ---->       used by VOC PASCAL 2012                   #
#                                                                                         #
# Developed by: Rafael Padilla ([email protected])                               #
#        SMT - Signal Multimedia and Telecommunications Lab                               #
#        COPPE - Universidade Federal do Rio de Janeiro                                   #
#        Last modification: May 24th 2018                                                 #
###########################################################################################

import _init_paths
from BoundingBox import BoundingBox
from BoundingBoxes import BoundingBoxes
from Evaluator import *
from utils import *
dt_path='/home/longmao/workspace/compute MAP/Object-Detection-Metrics/' \
        'samples/yolov3_compute_mAP/carplate.txt'
gt_path='/home/longmao/darknet/VOCdevkit/VOC2007/ImageSets/Main/test.txt'

def getBoundingBoxes(dt_path,gt_path):
    """Read txt files containing bounding boxes (ground truth and detections)."""
    allBoundingBoxes = BoundingBoxes()
    import glob
    import os
    # Read ground truths
    # Class representing bounding boxes (ground truths and detections)
    allBoundingBoxes = BoundingBoxes()
    # Read GT detections from txt file
    # Each line of the files in the groundtruths folder represents a ground truth bounding box
    # (bounding boxes that a detector should detect)
    # Each value of each line is  "class_id, x, y, width, height" respectively
    # Class_id represents the class of the bounding box
    # x, y represents the most top-left coordinates of the bounding box
    # x2, y2 represents the most bottom-right coordinates of the bounding box
    label_path='/home/longmao/darknet/VOCdevkit/VOC2007/labels'
    with open(gt_path,'r') as file_para:
        files=file_para.readlines()
        for f in files:
            f=f.strip()
            idClass = os.path.splitext(os.path.basename(dt_path))[0]
            nameOfImage=f
            with open(os.path.join(label_path,f)+'.txt','r') as a:
                b=a.readlines()
                for c in b:
                    c=c.strip()
                    splitLine=c.split()
                    x = float(splitLine[1])  # confidence
                    y = float(splitLine[2])
                    w = float(splitLine[3])
                    h = float(splitLine[4])
                    bb = BoundingBox(
                        nameOfImage,
                        idClass,
                        x,
                        y,
                        w,
                        h,
                        CoordinatesType.Relative,
                        imgSize=(1920,1080),
                        bbType=BBType.GroundTruth,
                        format=BBFormat.XYWH)
                    allBoundingBoxes.addBoundingBox(bb)
    # Read detections
    # Read detections from txt file
    # Each line of the files in the detections folder represents a detected bounding box.
    # Each value of each line is  "class_id, confidence, x, y, width, height" respectively
    # Class_id represents the class of the detected bounding box
    # Confidence represents confidence (from 0 to 1) that this detection belongs to the class_id.
    # x, y represents the most top-left coordinates of the bounding box
    # x2, y2 represents the most bottom-right coordinates of the bounding box
    with open(dt_path,'r') as files_para:
        files=files_para.readlines()
        idClass=os.path.splitext(os.path.basename(dt_path))[0]
        for f in files:
                f=f.strip()
                print(f)
                splitLine = f.split(" ")
                nameOfImage = splitLine[0]  # class
                confidence = float(splitLine[1])  # confidence
                x = float(splitLine[2])
                y = float(splitLine[3])
                w = float(splitLine[4])
                h = float(splitLine[5])
                print(idClass,nameOfImage,x,y,w,h)
                bb = BoundingBox(
                    nameOfImage,
                    idClass,
                    x,
                    y,
                    w,
                    h,
                    CoordinatesType.Absolute, (1920, 1080),
                    BBType.Detected,
                    confidence,
                    format=BBFormat.XYX2Y2)
                allBoundingBoxes.addBoundingBox(bb)
    print(type(allBoundingBoxes))
    return allBoundingBoxes
# getBoundingBoxes(dt_path,gt_path=gt_path)
def createImages(dictGroundTruth, dictDetected):
    """Create representative images with bounding boxes."""
    import numpy as np
    import cv2
    # Define image size
    width = 200
    height = 200
    # Loop through the dictionary with ground truth detections
    for key in dictGroundTruth:
        image = np.zeros((height, width, 3), np.uint8)
        gt_boundingboxes = dictGroundTruth[key]
        image = gt_boundingboxes.drawAllBoundingBoxes(image)
        detection_boundingboxes = dictDetected[key]
        image = detection_boundingboxes.drawAllBoundingBoxes(image)
        # Show detection and its GT
        cv2.imshow(key, image)
        cv2.waitKey()


# Read txt files containing bounding boxes (ground truth and detections)
boundingboxes = getBoundingBoxes(dt_path,gt_path)
# Uncomment the line below to generate images based on the bounding boxes
# createImages(dictGroundTruth, dictDetected)
# Create an evaluator object in order to obtain the metrics
evaluator = Evaluator()
##############################################################
# VOC PASCAL Metrics
##############################################################
# Plot Precision x Recall curve
evaluator.PlotPrecisionRecallCurve(
    boundingboxes,  # Object containing all bounding boxes (ground truths and detections)
    IOUThreshold=0.3,  # IOU threshold
    method=MethodAveragePrecision.EveryPointInterpolation,  # As the official matlab code
    showAP=True,  # Show Average Precision in the title of the plot
    showInterpolatedPrecision=True)  # Plot the interpolated precision curve
# Get metrics with PASCAL VOC metrics
metricsPerClass = evaluator.GetPascalVOCMetrics(
    boundingboxes,  # Object containing all bounding boxes (ground truths and detections)
    IOUThreshold=0.3,  # IOU threshold
    method=MethodAveragePrecision.EveryPointInterpolation)  # As the official matlab code
print("Average precision values per class:\n")
# Loop through classes to obtain their metrics
for mc in metricsPerClass:
    # Get metric values per each class
    c = mc['class']
    precision = mc['precision']
    recall = mc['recall']
    average_precision = mc['AP']
    ipre = mc['interpolated precision']
    irec = mc['interpolated recall']
    # Print AP per class
    print('%s: %f' % (c, average_precision))
- 不同的网络测试所得结果可能不同,可能是每张图片生成一个txt识别结果文件,但本文默认将所有识别结果存入一个txt文件中,这里会有一个情况,如果该张图片一个识别结果都没有时,我们就跳过这张图片,不将该图片的识别结果放入txt文件中即可。