Datawhale机器学习算法之逻辑回归
0、我的理解
学习地址:https://developer.aliyun.com/ai/scenario/9ad3416619b1423180f656d1c9ae44f7
什么是逻辑回归,记住一句话“逻辑回归是分类算法”即可。
1、基础Demo入门
1)相关库导入
# 数学计算
import numpy as np

# 导入画图库
import matplotlib.pyplot as plt
import seaborn as sns

# 导入逻辑回归模型函数
from sklearn.linear_model import LogisticRegression
2)训练模型
首先我们需要自己构建demo数据集,然后利用sklearn调用逻辑回归模型,然后对数据集进行拟合。
# 构造demo数据集
x_fearures = np.array([[-1, -2], [-2, -1], [-3, -2], [1, 3], [2, 1], [3, 2]])
y_label = np.array([0, 0, 0, 1, 1, 1])

# 调用逻辑回归模型
lr_clf = LogisticRegression()

# 用逻辑回归模型拟合demo数据集
lr_clf = lr_clf.fit(x_fearures, y_label) #其拟合方程为 y=w0+w1*x1+w2*x2
3)查看模型参数
##查看其对应模型的w
print('the weight of Logistic Regression:',lr_clf.coef_)
##查看其对应模型的w0
print('the intercept(w0) of Logistic Regression:',lr_clf.intercept_)
4)数据和模型可视化
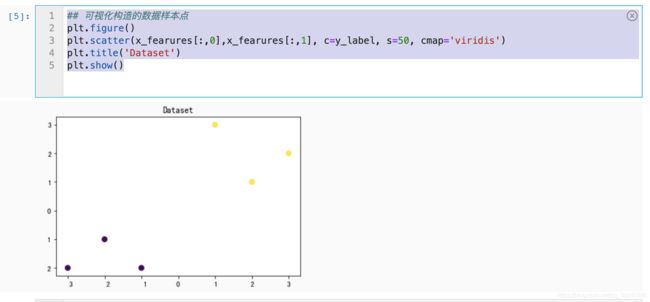
demo数据集可视化
## 可视化构造的数据样本点
plt.figure()
plt.scatter(x_fearures[:,0],x_fearures[:,1], c=y_label, s=50, cmap='viridis')
plt.title('Dataset')
plt.show()
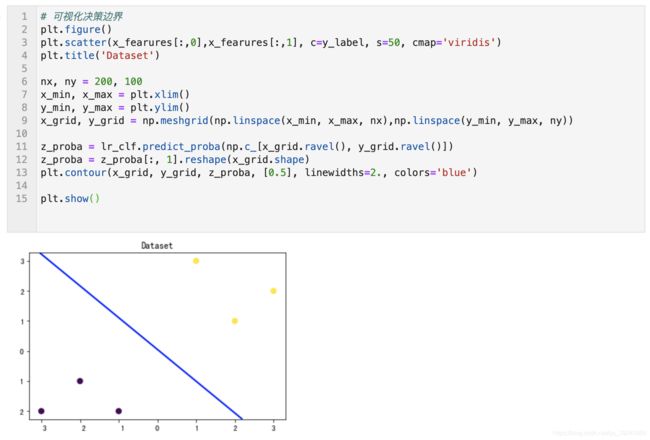
# 可视化决策边界
plt.figure()
plt.scatter(x_fearures[:,0],x_fearures[:,1], c=y_label, s=50, cmap='viridis')
plt.title('Dataset')

nx, ny = 200, 100
x_min, x_max = plt.xlim()
y_min, y_max = plt.ylim()
x_grid, y_grid = np.meshgrid(np.linspace(x_min, x_max, nx),np.linspace(y_min, y_max, ny))

z_proba = lr_clf.predict_proba(np.c_[x_grid.ravel(), y_grid.ravel()])
z_proba = z_proba[:, 1].reshape(x_grid.shape)
plt.contour(x_grid, y_grid, z_proba, [0.5], linewidths=2., colors='blue')

plt.show()
### 可视化预测新样本

plt.figure()
## new point 1
x_fearures_new1 = np.array([[0, -1]])
plt.scatter(x_fearures_new1[:,0],x_fearures_new1[:,1], s=50, cmap='viridis')
plt.annotate(s='New point 1',xy=(0,-1),xytext=(-2,0),color='blue',arrowprops=dict(arrowstyle='-|>',connectionstyle='arc3',color='red'))

## new point 2
x_fearures_new2 = np.array([[1, 2]])
plt.scatter(x_fearures_new2[:,0],x_fearures_new2[:,1], s=50, cmap='viridis')
plt.annotate(s='New point 2',xy=(1,2),xytext=(-1.5,2.5),color='red',arrowprops=dict(arrowstyle='-|>',connectionstyle='arc3',color='red'))

## 训练样本
plt.scatter(x_fearures[:,0],x_fearures[:,1], c=y_label, s=50, cmap='viridis')
plt.title('Dataset')

# 可视化决策边界
plt.contour(x_grid, y_grid, z_proba, [0.5], linewidths=2., colors='blue')

plt.show()
5)模型预测
##在训练集和测试集上分布利用训练好的模型进行预测
y_label_new1_predict=lr_clf.predict(x_fearures_new1)
y_label_new2_predict=lr_clf.predict(x_fearures_new2)
print('The New point 1 predict class:\n',y_label_new1_predict)
print('The New point 2 predict class:\n',y_label_new2_predict)
##由于逻辑回归模型是概率预测模型(前文介绍的p = p(y=1|x,\theta)),所有我们可以利用predict_proba函数预测其概率
y_label_new1_predict_proba=lr_clf.predict_proba(x_fearures_new1)
y_label_new2_predict_proba=lr_clf.predict_proba(x_fearures_new2)
print('The New point 1 predict Probability of each class:\n',y_label_new1_predict_proba)
print('The New point 2 predict Probability of each class:\n',y_label_new2_predict_proba)


