python-opencv-matplotlib灰度图可视化处理
参考文章1、golgotha的ttps://www.jianshu.com/p/de9013f181d7
一、Demo
一、1.热度图
利用matplotlib可视化一张图片的灰度图。
纵横坐标为图片的像素点位置(x, y),此像素点的灰度值z(x, y)当作z轴上的取值。
首先利用plot_surface分析某张图片的灰度图
import matplotlib.pyplot as plt
from mpl_toolkits.mplot3d import Axes3D
import cv2 as cv
import numpy as np
from matplotlib import cm

fig = plt.figure()
ax = fig.add_subplot(111, projection='3d')

img = cv.imread("2.png")
gray_img = cv.cvtColor(img, cv.COLOR_RGB2GRAY)

X = np.arange(0, gray_img.shape[1], 1) #取出X轴数据
Y = np.arange(0, gray_img.shape[0], 1) #取出Y轴数据
X, Y = np.meshgrid(X, Y) # 网格化
Z = gray_img  #这里为三维数据
#Plot the surface.
surf = ax.plot_surface(X, Y, Z, cmap=cm.coolwarm, linewidth=0, antialiased=False)
#Customize the z axis.Add a color bar which maps values to colors.
fig.colorbar(surf, shrink=0.5, aspect=5) # 在旁边加一个热度颜色谱,不要的话可以删掉
plt.show()
效果图

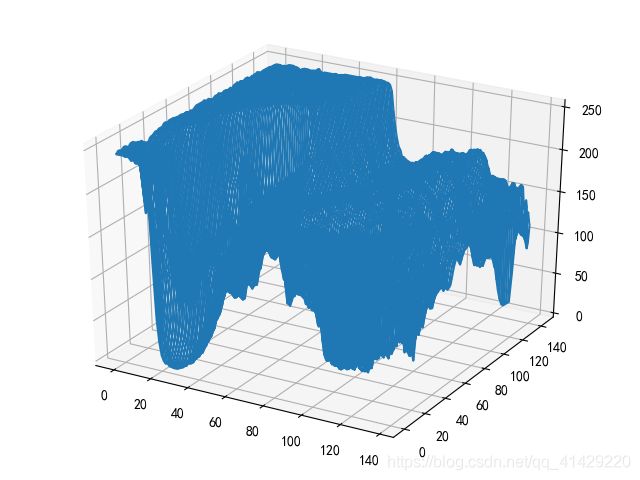
一、2.网格图
网格图将surf语句更改掉并删掉fig.colorbar语句就可以了
surf = ax.plot_wireframe(X, Y, Z, rstride=1, cstride=1)
一、3.三角剖分曲面图()
import matplotlib.pyplot as plt
from mpl_toolkits.mplot3d import Axes3D
import cv2 as cv

fig = plt.figure()
ax = fig.add_subplot(111, projection='3d')

img = cv.imread("2.png")
gray_img = cv.cvtColor(img, cv.COLOR_RGB2GRAY)

x = []
y = []
z = []
for yi in range(0, gray_img.shape[0]):
    for xi in range(0, gray_img.shape[1]):
        y.append(yi)
        x.append(xi)
        z.append(gray_img[yi][xi] * 255)
ax.plot_trisurf(x,y,z)
plt.show()
效果图
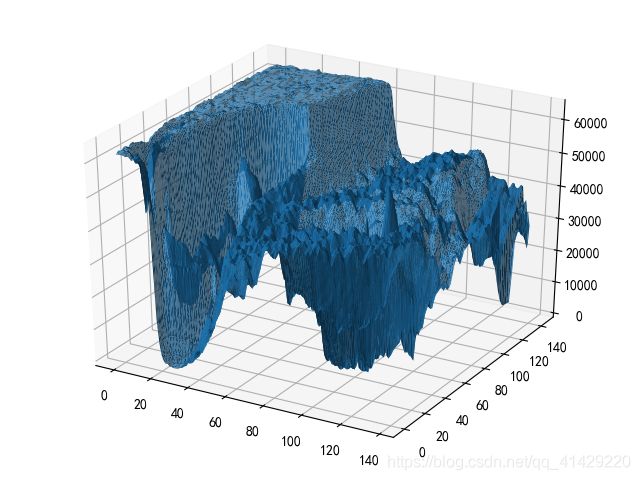
个人感觉第三种比较形象,能够清晰的看到纹理