如何优雅地在Mac上使用VS Code调试Python程序(How to use a Debugger)
安装插件
首先你需要在 VScode 中安装 python 插件(在 Mac 上如果因为 rg 程序,产生高 CPU,请看解决方法)
配置Python调试
找到 Debug 界面
在 launch.json 的 Add Configuration 中选择 Python FIle(如果一开始launch.json文件,可以点调试键,选择 Python,然后它会自动生成一个)

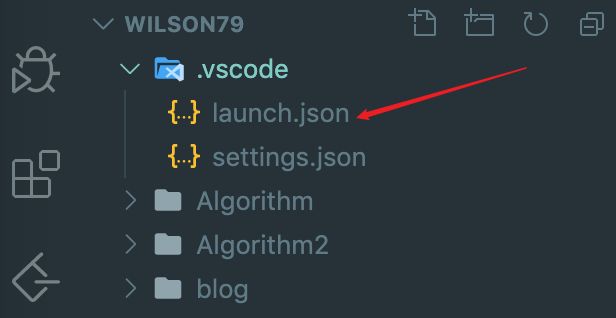
launch.json文件
{
    // Use IntelliSense to learn about possible attributes.
    // Hover to view descriptions of existing attributes.
    // For more information, visit: https://go.microsoft.com/fwlink/?linkid=830387
    "version": "0.2.0",
    "configurations": [
        {
            "name": "Python: Current File",
            "type": "python",
            "request": "launch",
            "program": "${file}",
            "console": "integratedTerminal"
        },
    ]
}
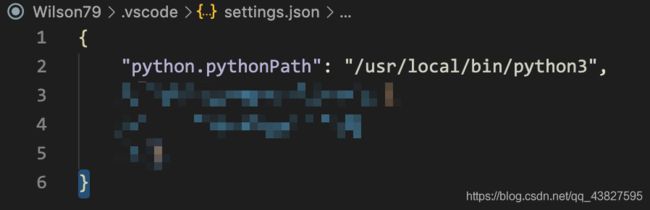
另外你需要在 launch.json 的同目录下创建一个settings.json,内容如下:
{
    "python.pythonPath": "/usr/local/bin/python3",
}
保存后重启 VScode。选择某个 python 文件点击 debug 界面的绿色的箭头(选择选择 Python: Current File)或 按F5 开启调试模式!
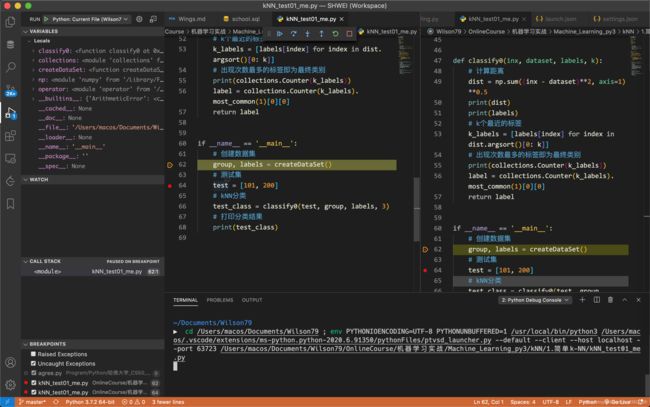
配置成功后的界面如下图所示:
报错解决
之前我配置好以后,是可以调试的,但是不知道为什么过一段时间后突然无法打开调试模式了
报错如下:

查了半天,发现别人按这样配置都是成功的,为什么我就不行呢?后来看到一篇文章里面他们的 cd 后面是有个 ; 的,我的却没有,所以导致了cd: too many arguments的问题。
那为什么我的没有 ; 呢???
问题解决
想了一段时候后,终于明白了!原来是我在 zshrc 中设置了 ; 自动补全,所以这个分号被用掉了!
解决方法
把 ~/.zshrc 中的自动补全快捷键修改成另外的快捷键(推荐 ctrl + space)
bindkey '^ ' autosuggest-accept
重启 VScode 后(必须重启,source 没用的),就能顺利进入 Python 调试模式了
修Bug的经验
在终端设置的某些快捷键,例如,; 自动补全,` tmux 前缀,fzf 的一些 ctrl 系列快捷键,这些可能会影响你命令行的输入,比如少个 ; 符号等!!!
这个坑点往往是很难发现的,因为我会本能地去想是不是 python 插件出了问题,是不是插件版本的问题,是不是 json 配置有问题,结果路走反了,也走远了,实际上是终端快捷键的问题
如何使用调试模式
一般情况下我们自己写的代码没有必要用调试模式,用 print 大法就够用了,但是当我们使用别人的代码或者大型的开源代码时,我们需要同时监测很多变量,这时再用 print 就会显得很低效,而使用调试工具将有助于我们高效地理解代码以及解决报错
按 F5 启动调试(至少要有一个断点,因为 Debug 模式遇到断点才会停止)

黄色行表示即将执行这一行
监视窗口:在 watch 可以手动添加自己想要监视的变量或变量表达式,例如 nums[:4],a < b 等
CALL STACK :查看 scope 的层级
调试控制台:可以输入变量查看结果
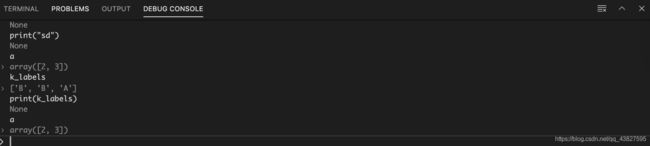
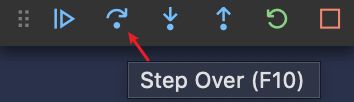
调试continue、step over、step into、step out
Continue – An action to take in the debugger that will continue execution until the next breakpoint is reached or the program exits.(直到遇到下一个断点后停止,断点的顺序是按照程序的逻辑运行顺序来排的)
Step over – An action to take in the debugger that will step over a given line. If the line contains a function the function will be executed and the result returned without debugging each line.(简单来说,就是无脑地往下移动一行)
Step into – An action to take in the debugger. If the line does not contain a function it behaves the same as “step over” but if it does the debugger will enter the called function and continue line-by-line debugging there.
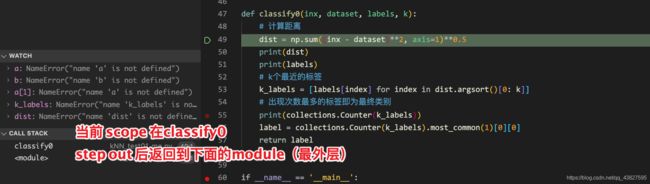
Step out – An action to take in the debugger that returns to the line where the current function was called.(按照 CALL STACK 中的顺序 scope 退一层)
https://www.fourkitchens.com/blog/article/step-step-through-debugging/
Debugger视频教程
更多调试用法请看视频:2020-如何正确用VSCode调试Python程序
参考资料
[1] 使用VS Code调试Python程序
[2] Python 使用VS Code进行调试