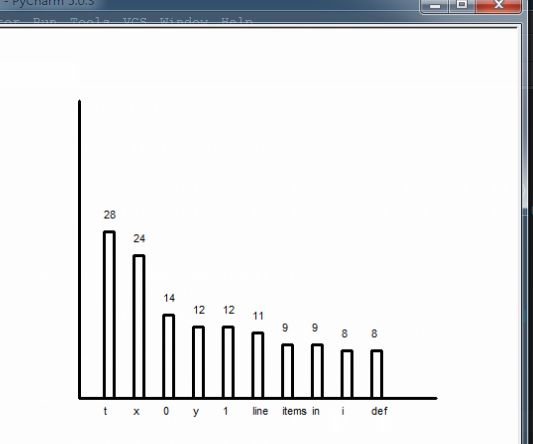
python简单练习 -统计文本词频并用柱状图显示
函数功能:统计文本中单词频率,并用柱状图显示前10个最高的单词
这里统计的是函数所在文件本身
import turtle

count = 10
data = []
words = []
# y
yScale = 6
# X
xScale = 30

def drawLine(t, x1, y1, x2, y2):
    t.penup()
    t.goto(x1, y1)
    t.pendown()
    t.goto(x2, y2)

def drawText(t, x, y, text):
    t.penup()
    t.goto(x, y)
    t.pendown()
    t.write(text)

def drawRectangle(t, x, y):
    x = x*xScale
    y = y*yScale
    drawLine(t, x-5, 0, x-5, y)
    drawLine(t, x-5, y, x+5, y)
    drawLine(t, x+5, y, x+5, 0)
    drawLine(t, x+5, 0, x-5, 0)

def drawBar(t):
    for i in range(count):
        drawRectangle(t, i+1, data[i])

def drawGraph(t):
    drawLine(t, 0, 0, 360, 0)
    drawLine(t, 0, 300, 0, 0)

    for x in range(count):
        x=x+1
        drawText(t, x*xScale-4, -20, (words[x-1]))
        drawText(t, x*xScale-4, data[x-1]*yScale+10, data[x-1])
    drawBar(t)

def replacePunctuations(line):
    for ch in line:
        if ch in "!\"#$%&'()*+,-./:;<=>?@[\\]^_`{|}~":
            line = line.replace(ch, " ")
    return line

def processLine(line, wordCounts):
    line = replacePunctuations(line)
    words = line.split()
    for word in words:
        if word in wordCounts:
            wordCounts[word] += 1
        else:
            wordCounts[word] = 1

def main():
    filename = "test1.py"
    infile = open(filename, "r")

    wordCounts = {}
    for line in infile:
        processLine(line.lower(), wordCounts)

    pairs = list(wordCounts.items())

    items = [[x, y] for (y, x) in pairs]
    items.sort()

    for i in range(len(items)-1, len(items)-count-1, -1):
        print(items[i][1]+"\t"+str(items[i][0]))
        data.append(items[i][0])
        words.append(items[i][1])

    turtle.title("histogram")
    turtle.setup(900, 750, 0, 0)
    t = turtle.Turtle()
    t.hideturtle()
    t.width(3)
    drawGraph(t)

if __name__ == "__main__":
    main()
