关于xgboost的一些整理
XGBOOST的三大板块
XGBoost本身的核心是基于梯度提升树实现的集成算法,整体来说可以有三个核心部分:集成算法本身,用于集成的
弱评估器,以及应用中的其他过程。三个部分中,前两个部分包含了XGBoost的核心原理以及数学过程,最后的部分
主要是在XGBoost应用中占有一席之地。我们的课程会主要集中在前两部分,最后一部分内容将会在应用中少量给大
家提及。接下来,我们就针对这三个部分,来进行一一的讲解

from xgboost import XGBRegressor as XGBR
from sklearn.ensemble import RandomForestRegressor as RFR
from sklearn.linear_model import LinearRegression as LinearR
from sklearn.datasets import load_boston
from sklearn.model_selection import KFold,cross_val_score as CVS,train_test_split as TTS
from sklearn.metrics import mean_squared_error as MSE
import pandas as pd
import numpy as np
import os
import matplotlib.pyplot as plt
from time import time
import datetime
data = load_boston()
data
{'data': array([[6.3200e-03, 1.8000e+01, 2.3100e+00, ..., 1.5300e+01, 3.9690e+02,
         4.9800e+00],
        [2.7310e-02, 0.0000e+00, 7.0700e+00, ..., 1.7800e+01, 3.9690e+02,
         9.1400e+00],
        [2.7290e-02, 0.0000e+00, 7.0700e+00, ..., 1.7800e+01, 3.9283e+02,
         4.0300e+00],
        ...,
        [6.0760e-02, 0.0000e+00, 1.1930e+01, ..., 2.1000e+01, 3.9690e+02,
         5.6400e+00],
        [1.0959e-01, 0.0000e+00, 1.1930e+01, ..., 2.1000e+01, 3.9345e+02,
         6.4800e+00],
        [4.7410e-02, 0.0000e+00, 1.1930e+01, ..., 2.1000e+01, 3.9690e+02,
         7.8800e+00]]),
 'target': array([24. , 21.6, 34.7, 33.4, 36.2, 28.7, 22.9, 27.1, 16.5, 18.9, 15. ,
        18.9, 21.7, 20.4, 18.2, 19.9, 23.1, 17.5, 20.2, 18.2, 13.6, 19.6,
        15.2, 14.5, 15.6, 13.9, 16.6, 14.8, 18.4, 21. , 12.7, 14.5, 13.2,
        13.1, 13.5, 18.9, 20. , 21. , 24.7, 30.8, 34.9, 26.6, 25.3, 24.7,
        21.2, 19.3, 20. , 16.6, 14.4, 19.4, 19.7, 20.5, 25. , 23.4, 18.9,
        35.4, 24.7, 31.6, 23.3, 19.6, 18.7, 16. , 22.2, 25. , 33. , 23.5,
        19.4, 22. , 17.4, 20.9, 24.2, 21.7, 22.8, 23.4, 24.1, 21.4, 20. ,
        20.8, 21.2, 20.3, 28. , 23.9, 24.8, 22.9, 23.9, 26.6, 22.5, 22.2,
        23.6, 28.7, 22.6, 22. , 22.9, 25. , 20.6, 28.4, 21.4, 38.7, 43.8,
        33.2, 27.5, 26.5, 18.6, 19.3, 20.1, 19.5, 19.5, 20.4, 19.8, 19.4,
        21.7, 22.8, 18.8, 18.7, 18.5, 18.3, 21.2, 19.2, 20.4, 19.3, 22. ,
        20.3, 20.5, 17.3, 18.8, 21.4, 15.7, 16.2, 18. , 14.3, 19.2, 19.6,
        23. , 18.4, 15.6, 18.1, 17.4, 17.1, 13.3, 17.8, 14. , 14.4, 13.4,
        15.6, 11.8, 13.8, 15.6, 14.6, 17.8, 15.4, 21.5, 19.6, 15.3, 19.4,
        17. , 15.6, 13.1, 41.3, 24.3, 23.3, 27. , 50. , 50. , 50. , 22.7,
        25. , 50. , 23.8, 23.8, 22.3, 17.4, 19.1, 23.1, 23.6, 22.6, 29.4,
        23.2, 24.6, 29.9, 37.2, 39.8, 36.2, 37.9, 32.5, 26.4, 29.6, 50. ,
        32. , 29.8, 34.9, 37. , 30.5, 36.4, 31.1, 29.1, 50. , 33.3, 30.3,
        34.6, 34.9, 32.9, 24.1, 42.3, 48.5, 50. , 22.6, 24.4, 22.5, 24.4,
        20. , 21.7, 19.3, 22.4, 28.1, 23.7, 25. , 23.3, 28.7, 21.5, 23. ,
        26.7, 21.7, 27.5, 30.1, 44.8, 50. , 37.6, 31.6, 46.7, 31.5, 24.3,
        31.7, 41.7, 48.3, 29. , 24. , 25.1, 31.5, 23.7, 23.3, 22. , 20.1,
        22.2, 23.7, 17.6, 18.5, 24.3, 20.5, 24.5, 26.2, 24.4, 24.8, 29.6,
        42.8, 21.9, 20.9, 44. , 50. , 36. , 30.1, 33.8, 43.1, 48.8, 31. ,
        36.5, 22.8, 30.7, 50. , 43.5, 20.7, 21.1, 25.2, 24.4, 35.2, 32.4,
        32. , 33.2, 33.1, 29.1, 35.1, 45.4, 35.4, 46. , 50. , 32.2, 22. ,
        20.1, 23.2, 22.3, 24.8, 28.5, 37.3, 27.9, 23.9, 21.7, 28.6, 27.1,
        20.3, 22.5, 29. , 24.8, 22. , 26.4, 33.1, 36.1, 28.4, 33.4, 28.2,
        22.8, 20.3, 16.1, 22.1, 19.4, 21.6, 23.8, 16.2, 17.8, 19.8, 23.1,
        21. , 23.8, 23.1, 20.4, 18.5, 25. , 24.6, 23. , 22.2, 19.3, 22.6,
        19.8, 17.1, 19.4, 22.2, 20.7, 21.1, 19.5, 18.5, 20.6, 19. , 18.7,
        32.7, 16.5, 23.9, 31.2, 17.5, 17.2, 23.1, 24.5, 26.6, 22.9, 24.1,
        18.6, 30.1, 18.2, 20.6, 17.8, 21.7, 22.7, 22.6, 25. , 19.9, 20.8,
        16.8, 21.9, 27.5, 21.9, 23.1, 50. , 50. , 50. , 50. , 50. , 13.8,
        13.8, 15. , 13.9, 13.3, 13.1, 10.2, 10.4, 10.9, 11.3, 12.3,  8.8,
         7.2, 10.5,  7.4, 10.2, 11.5, 15.1, 23.2,  9.7, 13.8, 12.7, 13.1,
        12.5,  8.5,  5. ,  6.3,  5.6,  7.2, 12.1,  8.3,  8.5,  5. , 11.9,
        27.9, 17.2, 27.5, 15. , 17.2, 17.9, 16.3,  7. ,  7.2,  7.5, 10.4,
         8.8,  8.4, 16.7, 14.2, 20.8, 13.4, 11.7,  8.3, 10.2, 10.9, 11. ,
         9.5, 14.5, 14.1, 16.1, 14.3, 11.7, 13.4,  9.6,  8.7,  8.4, 12.8,
        10.5, 17.1, 18.4, 15.4, 10.8, 11.8, 14.9, 12.6, 14.1, 13. , 13.4,
        15.2, 16.1, 17.8, 14.9, 14.1, 12.7, 13.5, 14.9, 20. , 16.4, 17.7,
        19.5, 20.2, 21.4, 19.9, 19. , 19.1, 19.1, 20.1, 19.9, 19.6, 23.2,
        29.8, 13.8, 13.3, 16.7, 12. , 14.6, 21.4, 23. , 23.7, 25. , 21.8,
        20.6, 21.2, 19.1, 20.6, 15.2,  7. ,  8.1, 13.6, 20.1, 21.8, 24.5,
        23.1, 19.7, 18.3, 21.2, 17.5, 16.8, 22.4, 20.6, 23.9, 22. , 11.9]),
 'feature_names': array(['CRIM', 'ZN', 'INDUS', 'CHAS', 'NOX', 'RM', 'AGE', 'DIS', 'RAD',
        'TAX', 'PTRATIO', 'B', 'LSTAT'], dtype='
X = data.data
Y = data.target
print('X',X.shape,'Y',Y.shape)
X (506, 13) Y (506,)
x_train,x_valid,y_train,y_valid = TTS(X,Y,test_size=0.3,random_state=420)
reg = XGBR(n_estimators = 100).fit(x_train,y_train) #train
y_pred = reg.predict(x_valid)
reg.score(x_valid,y_valid)
0.9050988954757183
MSE(y_pred,y_valid)
8.830916470718748
reg.feature_importances_
array([0.01902167, 0.0042109 , 0.01478317, 0.00553536, 0.02222195,
       0.37914094, 0.01679687, 0.04698721, 0.04073574, 0.05491758,
       0.0668422 , 0.00869463, 0.32011184], dtype=float32)
试试交叉验证以及随机森林和lr的对比
# 交叉验证导入的都是没有经过fit的模型
reg = XGBR(n_estimators = 100)
CVS(reg,x_train,y_train,cv = 5).mean()
0.7995062802699481
#查看一下sklearn中所有的模型评估指标
import sklearn
sorted(sklearn.metrics.SCORERS.keys())
['accuracy',
 'adjusted_mutual_info_score',
 'adjusted_rand_score',
 'average_precision',
 'balanced_accuracy',
 'completeness_score',
 'explained_variance',
 'f1',
 'f1_macro',
 'f1_micro',
 'f1_samples',
 'f1_weighted',
 'fowlkes_mallows_score',
 'homogeneity_score',
 'jaccard',
 'jaccard_macro',
 'jaccard_micro',
 'jaccard_samples',
 'jaccard_weighted',
 'max_error',
 'mutual_info_score',
 'neg_brier_score',
 'neg_log_loss',
 'neg_mean_absolute_error',
 'neg_mean_gamma_deviance',
 'neg_mean_poisson_deviance',
 'neg_mean_squared_error',
 'neg_mean_squared_log_error',
 'neg_median_absolute_error',
 'neg_root_mean_squared_error',
 'normalized_mutual_info_score',
 'precision',
 'precision_macro',
 'precision_micro',
 'precision_samples',
 'precision_weighted',
 'r2',
 'recall',
 'recall_macro',
 'recall_micro',
 'recall_samples',
 'recall_weighted',
 'roc_auc',
 'roc_auc_ovo',
 'roc_auc_ovo_weighted',
 'roc_auc_ovr',
 'roc_auc_ovr_weighted',
 'v_measure_score']
使用随机森林和lr进行对比
clf = RFR(n_estimators=100)
CVS(clf,x_train,y_train,cv = 5).mean()
0.7973593265910643
clf = LinearR()
CVS(clf,x_train,y_train,cv = 5).mean()
0.6835070597278079
4.定义绘制以训练样本数为横坐标的学习曲线的函数
def plot_learning_curve(estimator,title,X,y,ax = None,#选择子图
                        ylim = None,#设置纵坐标取值范围
                        cv = None,#交叉验证
                        n_jobs = None#设定所要使用的线程
                       ):
    from sklearn.model_selection import learning_curve
    train_sizes,train_scores,test_scores = learning_curve(estimator,X,y,shuffle = True,cv = cv,random_state=2020,n_jobs = n_jobs)
    if ax == None:
        ax = plt.gca()
    else:
        ax = plt.figure()
    ax.set_title(title)
    if ylim is not None:
        ax.set_ylim(*ylim)
    ax.set_xlabel('Training examples')
    ax.set_ylabel('Score')
    ax.grid()#绘制表格,不是必须
    ax.plot(train_sizes,np.mean(train_scores,axis = 1),'o-',color='r',label='Training score')
    ax.plot(train_sizes,np.mean(test_scores,axis = 1),'o-',color='g',label='Test score')
    ax.legend(loc = 'best')
    return ax
cv = KFold(n_splits=5, shuffle = True, random_state=42) #交叉验证模式
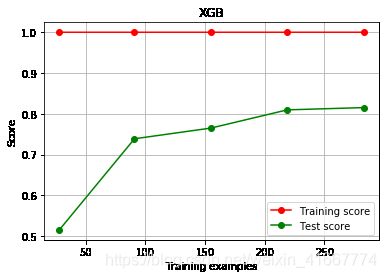
plot_learning_curve(XGBR(n_estimators = 100,random_state = 2020),'XGB',x_train,y_train,ax = None,cv = cv)
axisx = range(10,1010,50)
rs = []
for i in axisx:
    reg = XGBR(n_estimators = i,random_state = 2020)
    rs.append(CVS(reg,x_train,y_train,cv =cv).mean())
print(axisx[rs.index(max(rs))],max(rs))
plt.figure(figsize = (20,5))
plt.plot(axisx,rs,c = 'red',label = 'XGB')
plt.legend()
plt.show()
60 0.8160306064219636
7.进化的学习曲线:方差与泛化误差
一个集成模型(f)在未知数据集(D)上的泛化误差E(f;D),由方差(var),偏差(bais)和噪声共同决定。其中偏差就是训练集上的拟合程度决定,
方差是模型的稳定性决定,噪音是不可控的。而泛化误差越小,模型就越理想。
# %%time
# axisx = range(50,1050,50)
# rs = []
# var = []
# ge = []
# for i in axisx:
#     reg = XGBR(n_estimators = i,random_state = 2020)
#     cvresult = CVS(reg,x_train,y_train,cv = cv)
#     # 1。记录偏差
#     rs.append(cvresult.mean())
# #     2.记录方差
#     var.append(cvresult.var())
# #     3.计算泛化误差的可控部分
#     ge.append(cvresult.mean()**2+cvresult.var())
# #     打印R平方所对应最高的参数取值
# print(axisx[rs.index(max(rs))],max(rs),var[rs.index(max(rs))])
# # 打印方差最低时所对应的参数取值,并打印这个参数下的R平方
# print(axisx[var.index(min(var))],rs[var.index(min(var))],min(var))
# # 打印泛化误差可控部分的参数取值,并打印这个参数的R平方,方差以及泛化误差的可控部分
# print(axisx[ge.index(min(ge))],rs[ge.index(min(ge))],var[ge.index(min(ge))],min(ge))
# plt.figure(figsize = (20,5))
# plt.plot(axisx,rs,c = 'red',label='XGB')
# plt.legend()
# plt.show()
#======【TIME WARNING: 20s】=======#
axisx = range(50,1050,50)
rs = []
var = []
ge = []
for i in axisx:
    reg = XGBR(n_estimators=i,random_state=420)
    cvresult = CVS(reg,x_train,y_train,cv=cv)
    #记录1-偏差
    rs.append(cvresult.mean())
    #记录方差
    var.append(cvresult.var())
    #计算泛化误差的可控部分
    ge.append((1 - cvresult.mean())**2+cvresult.var())
#打印R2最高所对应的参数取值,并打印这个参数下的方差
print(axisx[rs.index(max(rs))],max(rs),var[rs.index(max(rs))])
#打印方差最低时对应的参数取值,并打印这个参数下的R2
print(axisx[var.index(min(var))],rs[var.index(min(var))],min(var))
#打印泛化误差可控部分的参数取值,并打印这个参数下的R2,方差以及泛化误差的可控部分
print(axisx[ge.index(min(ge))],rs[ge.index(min(ge))],var[ge.index(min(ge))],min(ge))
plt.figure(figsize=(20,5))
plt.plot(axisx,rs,c="red",label="XGB")
plt.legend()
plt.show()
50 0.8160201386205651 0.005672497727480616
100 0.8160140737049757 0.00563759790879684
150 0.8160183326076647 0.005637700057580302 0.03948695399404421
%%time
axisx = range(100,300,10)
rs = []
var = []
ge = []
for i in axisx:
    reg = XGBR(n_estimators = i,random_state = 2020)
    cvresult = CVS(reg,x_train,y_train,cv = cv)
    # 1。记录偏差
    rs.append(cvresult.mean())
#     2.记录方差
    var.append(cvresult.var())
#     3.计算泛化误差的可控部分
    ge.append(cvresult.mean()**2+cvresult.var())
#     打印R平方所对应最高的参数取值
print(axisx[rs.index(max(rs))],max(rs),var[rs.index(max(rs))])
# 打印方差最低时所对应的参数取值,并打印这个参数下的R平方
print(axisx[var.index(min(var))],rs[var.index(min(var))],min(var))
# 打印泛化误差可控部分的参数取值,并打印这个参数的R平方,方差以及泛化误差的可控部分
print(axisx[ge.index(min(ge))],rs[ge.index(min(ge))],var[ge.index(min(ge))],min(ge))
plt.figure(figsize = (20,5))
plt.plot(axisx,rs,c = 'black',label='XGB')
print(len(rs),len(var),len(ge))
rs = np.array(rs)
var = np.array(var)*0.01
# 添加方差线
plt.plot(axisx,rs+var,c = 'red',linestyle='-.')
plt.plot(axisx,rs-var,c = 'red',linestyle='-.')
plt.legend()
plt.show()
# axisx = range(100,300,10)
# rs = []
# var = []
# ge = []
# for i in axisx:
#     reg = XGBR(n_estimators=i,random_state=420)
#     cvresult = CVS(reg,x_train,y_train,cv=cv)
#     rs.append(cvresult.mean())
#     var.append(cvresult.var())
#     ge.append((1 - cvresult.mean())**2+cvresult.var())
# print(axisx[rs.index(max(rs))],max(rs),var[rs.index(max(rs))])
# print(axisx[var.index(min(var))],rs[var.index(min(var))],min(var))
# print(axisx[ge.index(min(ge))],rs[ge.index(min(ge))],var[ge.index(min(ge))],min(ge))
# rs = np.array(rs)
# var = np.array(var)*0.01
# plt.figure(figsize=(20,5))
# plt.plot(axisx,rs,c="black",label="XGB")
# #添加方差线
# plt.plot(axisx,rs+var,c="red",linestyle='-.')
# plt.plot(axisx,rs-var,c="red",linestyle='-.')
# plt.legend()
# plt.show()
120 0.8160268633349743 0.005636383455806455
110 0.8160216902884058 0.005635613656365494
100 0.8160140737049757 0.00563759790879684 0.6715165663933863
20 20 20
CPU times: user 47.3 s, sys: 378 ms, total: 47.7 s
Wall time: 6.36 s
#验证模型效果是否提高了?
time0 = time()
print(XGBR(n_estimators=100,random_state=420).fit(x_train,y_train).score(x_valid,y_valid))
print(time()-time0)
0.9050988954757183
0.09877753257751465
#验证模型效果是否提高了?
time0 = time()
print(XGBR(n_estimators=60,random_state=420).fit(x_train,y_train).score(x_valid,y_valid))
print(time()-time0)
0.9050148865586479
0.13165974617004395
axisx = np.linspace(0,1,20)
rs = []
for i in axisx:
    reg = XGBR(n_estimators=180,subsample=i,random_state=420)
    rs.append(CVS(reg,x_train,y_train
                  ,cv=cv).mean())
print(axisx[rs.index(max(rs))],max(rs))
plt.figure(figsize=(20,5))
plt.plot(axisx,rs,c="green",label="XGB")
plt.legend()
plt.show()
0.9473684210526315 0.8411078292936519
#继续细化学习曲线
axisx = np.linspace(0.05,1,20)
rs = []
var = []
ge = []
for i in axisx:
    reg = XGBR(n_estimators=180,subsample=i,random_state=420)
    cvresult = CVS(reg,x_train,y_train,cv=cv)
    rs.append(cvresult.mean())
    var.append(cvresult.var())
    ge.append((1 - cvresult.mean())**2+cvresult.var())
print(axisx[rs.index(max(rs))],max(rs),var[rs.index(max(rs))])
print(axisx[var.index(min(var))],rs[var.index(min(var))],min(var))
print(axisx[ge.index(min(ge))],rs[ge.index(min(ge))],var[ge.index(min(ge))],min(ge))
rs = np.array(rs)
var = np.array(var)
plt.figure(figsize=(20,5))
plt.plot(axisx,rs,c="black",label="XGB")
plt.plot(axisx,rs+var,c="red",linestyle='-.')
plt.plot(axisx,rs-var,c="red",linestyle='-.')
plt.legend()
plt.show()
0.9 0.8471829951410234 0.003032631211819389
0.7999999999999999 0.820435258668988 0.0021115261175072343
0.9 0.8471829951410234 0.003032631211819389 0.026385668185887882
#细化学习曲线
axisx = np.linspace(0.75,1,25)
rs = []
var = []
ge = []
for i in axisx:
    reg = XGBR(n_estimators=100,subsample=i,random_state=420)
    cvresult = CVS(reg,x_train,y_train,cv=cv)
    rs.append(cvresult.mean())
    var.append(cvresult.var())
    ge.append((1 - cvresult.mean())**2+cvresult.var())
print(axisx[rs.index(max(rs))],max(rs),var[rs.index(max(rs))])
print(axisx[var.index(min(var))],rs[var.index(min(var))],min(var))
print(axisx[ge.index(min(ge))],rs[ge.index(min(ge))],var[ge.index(min(ge))],min(ge))
rs = np.array(rs)
var = np.array(var)
plt.figure(figsize=(20,5))
plt.plot(axisx,rs,c="black",label="XGB")
plt.plot(axisx,rs+var,c="red",linestyle='-.')
plt.plot(axisx,rs-var,c="red",linestyle='-.')
plt.legend()
plt.show()
0.8854166666666666 0.8485454362942209 0.004252459987836936
0.90625 0.8319134570429213 0.0013124345773810925
0.84375 0.8467163651402497 0.0029360934500171285 0.02643196616583438
reg = XGBR(n_estimators=100
#           ,subsample=0.84375
           ,random_state=420).fit(x_train,y_train)
reg.score(x_valid,y_valid)
0.9050988954757183
MSE(reg.predict(x_valid),y_valid)
8.830916470718748
#首先我们先来定义一个评分函数,这个评分函数能够帮助我们直接打印Xtrain上的交叉验证结果
def regassess(reg,Xtrain,Ytrain,cv,scoring = ["r2"],show=True):
    score = []
    for i in range(len(scoring)):
        if show:
            print("{}:{:.2f}".format(scoring[i] #模型评估指标的名字
                                     ,CVS(reg
                                          ,Xtrain,Ytrain
                                          ,cv=cv,scoring=scoring[i]).mean()))
        score.append(CVS(reg,Xtrain,Ytrain,cv=cv,scoring=scoring[i]).mean())
    return score
regassess(reg,x_train,y_train,cv,scoring = ["r2","neg_mean_squared_error"],show=False)
[-6.065229871902296, -567.5706486921529]
# 重要参数eta
from time import time
import datetime

for i in [0,0.2,0.5,1]:
    time0=time()
    reg = XGBR(n_estimators=100, subsample=0.84375,random_state=420,learning_rate=i)
    print("learning_rate = {}".format(i))
    regassess(reg,x_train,y_train,cv,scoring = ["r2","neg_mean_squared_error"])
    print(datetime.datetime.fromtimestamp(time()-time0).strftime("%M:%S:%f"))
    print("\t")
learning_rate = 0
r2:-6.07
neg_mean_squared_error:-567.57
00:00:720643

learning_rate = 0.2
r2:0.84
neg_mean_squared_error:-12.56
00:00:960964

learning_rate = 0.5
r2:0.80
neg_mean_squared_error:-16.14
00:00:847662

learning_rate = 1
r2:0.69
neg_mean_squared_error:-24.86
00:00:659253
axisx = np.arange(0.05,1,0.05)
rs = []
te = []
for i in axisx:
    reg = XGBR(n_estimators=100,random_state=420,learning_rate=i)
    score = regassess(reg,x_train,y_train,cv,scoring = ["r2","neg_mean_squared_error"],show=False)
    test = reg.fit(x_train,y_train).score(x_valid,y_valid)
    rs.append(score[0])
    te.append(test)
print(axisx[rs.index(max(rs))],max(rs))
plt.figure(figsize=(20,5))
plt.plot(axisx,te,c="gray",label="test")
plt.plot(axisx,rs,c="green",label="train")
plt.legend()
plt.show()
0.15000000000000002 0.8469047975857826
3.XGBOOST的智慧
3.1选择弱评估器:重要参数booster
for booster in ['gbtree','gblinear','dart']:
    reg = XGBR(n_estimators = 100,learning_rate= 0.2,random_state = 2020,booster = booster).fit(x_train,y_train)
    print(booster)
    print(reg.score(x_valid,y_valid))
gbtree
0.9079161177984207
gblinear
0.6582298654606282
dart
0.9079161290435975
import xgboost as xgb
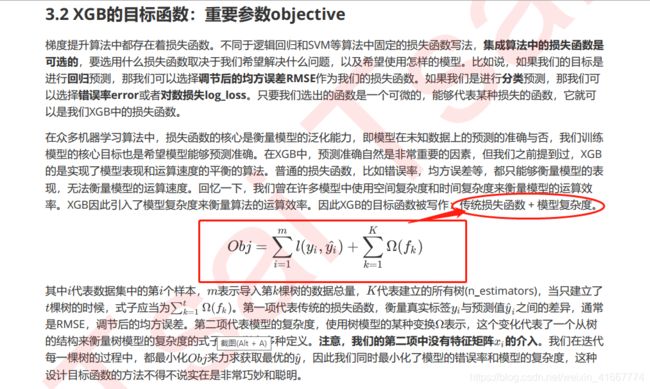
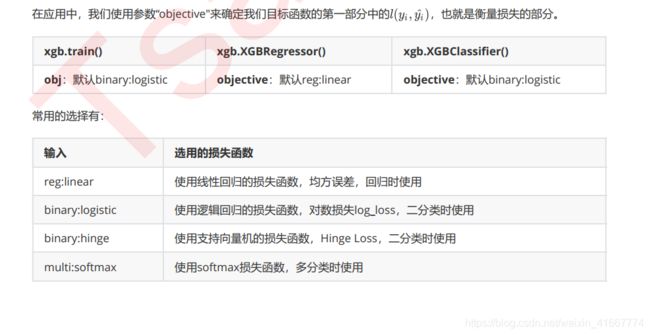
由于xgb中所有的参数都需要自己的输入,并且objective参数的默认值是二分类,因此我们必须手动调节。试试看在其他参数相同的情况下,我们xgboost库本身和sklearn比起来效果如何:
# 默认reg:linear
reg = XGBR(n_estimators = 100,random_state = 2020).fit(x_train,y_train)
print('r2',reg.score (x_valid,y_valid))
print('mse',MSE(reg.predict(x_valid),y_valid))
r2 0.9050988954757183
mse 8.830916470718748
# 1.使用类DMatrix读取数据
dtrain = xgb.DMatrix(x_train,label = y_train)
dvalid = xgb.DMatrix(x_valid,label = y_valid)
dtrain
# 2.写明参数param
params = { 'silent':False,
          'objective':'reg:linear',
          'eta':0.1
}
num_round = 100  #n_estimator
clf = xgb.train(params,dtrain,num_boost_round=num_round)
[18:03:47] WARNING: /workspace/src/objective/regression_obj.cu:170: reg:linear is now deprecated in favor of reg:squarederror.
[18:03:47] WARNING: /workspace/src/learner.cc:480:
Parameters: { silent } might not be used.

  This may not be accurate due to some parameters are only used in language bindings but
  passed down to XGBoost core.  Or some parameters are not used but slip through this
  verification. Please open an issue if you find above cases.


[18:03:47] WARNING: /workspace/src/objective/regression_obj.cu:170: reg:linear is now deprecated in favor of reg:squarederror.
preds = clf.predict(dvalid)
from sklearn.metrics import r2_score
r2_score(preds,y_valid)
0.9126862154094444
MSE(preds,y_valid)
6.9107686786779885
无论是从R2还是从MSE的角度来看,都是xgb库本身表现得更优秀
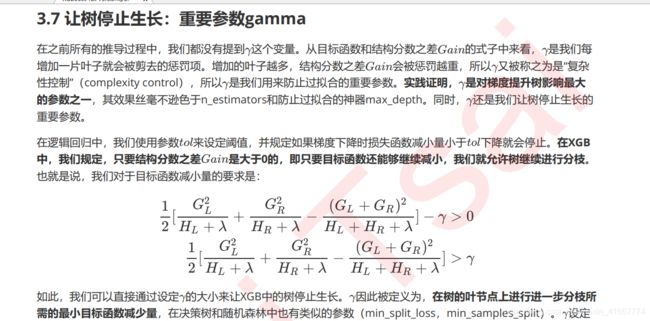
gamma设定越大,算法就越保守,树的叶子数量就越少,模型的复杂度就越低
axisx = np.arange(0,5,0.05)
rs = []
var = []
ge = []
for i in axisx:
    reg = XGBR(n_estimators = 100,random_state = 2020,gamma = i )
    cvresult = CVS(reg,x_train,y_train,cv=cv)
    #记录1-偏差
    rs.append(cvresult.mean())
    #记录方差
    var.append(cvresult.var())
    #计算泛化误差的可控部分
    ge.append((1 - cvresult.mean())**2+cvresult.var())
#打印R2最高所对应的参数取值,并打印这个参数下的方差
print(axisx[rs.index(max(rs))],max(rs),var[rs.index(max(rs))])
#打印方差最低时对应的参数取值,并打印这个参数下的R2
print(axisx[var.index(min(var))],rs[var.index(min(var))],min(var))
#打印泛化误差可控部分的参数取值,并打印这个参数下的R2,方差以及泛化误差的可控部分
print(axisx[ge.index(min(ge))],rs[ge.index(min(ge))],var[ge.index(min(ge))],min(ge))
plt.figure(figsize=(20,5))
plt.plot(axisx,rs,c="green",label="XGB")
rs = np.array(rs)
var = np.array(var)
plt.plot(axisx,rs+var,c="red",linestyle = '-.')
plt.plot(axisx,rs-var,c="red",linestyle = '-.')
plt.legend()
plt.show()
0.8 0.8408699342022397 0.005891400328804824
4.55 0.8270850729596535 0.0046054242273426945
0.6000000000000001 0.8398453567767341 0.004660988975473525 0.030310498721445114
可以看到,我们完全无法从中看出什么趋势,偏差时高时低,方差时大时小,参数gamma引起的波动远远超过其他参数(其他参数至少还有一个上升再平稳的过程,而gamma则是仿佛毫无规律)。在sklearn
下XGBOOST太不稳定,如果这样来调整参数的话,效果就很难保证。因此,为了调整gamma,我们需要来引入新的工具,xgboost库中的类xgboost.cv
import xgboost as xgb
dfull = xgb.DMatrix(X,Y)
%%time
# 设定参数
params = {'silent':True,
         'obj':'reg:linear',
         'gamma':0}
num_round = 100
n_fold = 5

# 使用xgb.cv

cvresult = xgb.cv(params,dfull,num_boost_round=num_round,nfold=n_fold)
CPU times: user 2.27 s, sys: 33.1 ms, total: 2.3 s
Wall time: 306 ms
cvresult
| train-rmse-mean | train-rmse-std | test-rmse-mean | test-rmse-std | |
|---|---|---|---|---|
| 0 | 17.105578 | 0.129116 | 17.163215 | 0.584296 |
| 1 | 12.337973 | 0.097557 | 12.519736 | 0.473458 |
| 2 | 8.994071 | 0.065756 | 9.404534 | 0.472309 |
| 3 | 6.629481 | 0.050323 | 7.250335 | 0.500342 |
| 4 | 4.954406 | 0.033209 | 5.920812 | 0.591874 |
| ... | ... | ... | ... | ... |
| 95 | 0.025204 | 0.005145 | 3.669921 | 0.858313 |
| 96 | 0.024422 | 0.005242 | 3.669983 | 0.858255 |
| 97 | 0.023661 | 0.005117 | 3.669947 | 0.858332 |
| 98 | 0.022562 | 0.004704 | 3.669869 | 0.858578 |
| 99 | 0.021496 | 0.004738 | 3.669824 | 0.858305 |
100 rows × 4 columns
plt.figure(figsize=(20,5))
plt.plot(range(1,101),cvresult.iloc[:,0],c="red",label="train,gamma = 0")
plt.plot(range(1,101),cvresult.iloc[:,2],c="orange",label="test,gamma = 0")
plt.legend()
plt.show()
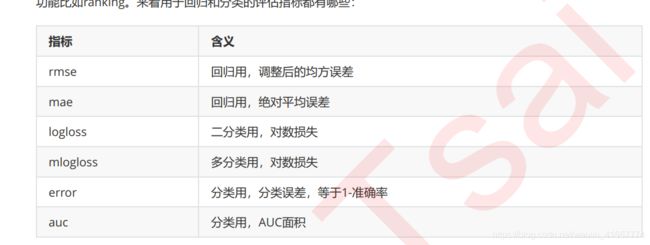
指标选择:
%%time
# 设定参数
params = {'silent':True,
         'obj':'reg:linear',
         'gamma':0,
         'eval_metric':'mae'}
num_round = 100
n_fold = 5

# 使用xgb.cv

cvresult = xgb.cv(params,dfull,num_boost_round=num_round,nfold=n_fold)
[03:01:58] WARNING: /workspace/src/learner.cc:480:
Parameters: { obj, silent } might not be used.
This may not be accurate due to some parameters are only used in language bindings but
passed down to XGBoost core. Or some parameters are not used but slip through this
verification. Please open an issue if you find above cases.
CPU times: user 2.11 s, sys: 25.1 ms, total: 2.13 s
Wall time: 285 ms
plt.figure(figsize=(20,5))
plt.plot(range(1,101),cvresult.iloc[:,0],c="red",label="train,gamma = 0")
plt.plot(range(1,101),cvresult.iloc[:,2],c="orange",label="test,gamma = 0")
plt.legend()
plt.show()
gamma避免过拟合就是使训练集上训练的不那么好,泛化能力增强,但是否在test上表现效果如何不能确定
%%time
# 设定参数
param1 = {'silent':True,
         'obj':'reg:linear',
         'gamma':0,
         'eval_metric':'mae'}
param2 = {'silent':True,
         'obj':'reg:linear',
         'gamma':20,
         'eval_metric':'mae'}
num_round = 100
n_fold = 5

# 使用xgb.cv

cvresult1 = xgb.cv(param1,dfull,num_boost_round=num_round,nfold=n_fold)
cvresult2 = xgb.cv(param2,dfull,num_boost_round=num_round,nfold=n_fold)
CPU times: user 3.88 s, sys: 50 ms, total: 3.93 s
Wall time: 511 ms
plt.figure(figsize=(20,5))
plt.plot(range(1,101),cvresult1.iloc[:,0],c="red",label="train,gamma = 0")
plt.plot(range(1,101),cvresult1.iloc[:,2],c="orange",label="test,gamma = 0")
plt.plot(range(1,101),cvresult2.iloc[:,0],c="green",label="train,gamma = 20")
plt.plot(range(1,101),cvresult2.iloc[:,2],c="blue",label="test,gamma = 20")
plt.legend()
plt.show()
# 试一个分类的任务
from sklearn.datasets import load_breast_cancer
data2 = load_breast_cancer()
x2 = data2.data
y2 = data2.target
dfull2 = xgb.DMatrix(x2,y2)
%%time
# 设定参数
param1 = {'silent':True,
         'obj':'binary:logistic',
         'gamma':0,
         'eval_metric':'mae'}
param2 = {'silent':True,
        'obj':'binary:logistic',
         'gamma':0.5,
         'eval_metric':'mae'}
num_round = 100
n_fold = 5

# 使用xgb.cv

cvresult1 = xgb.cv(param1,dfull2,num_boost_round=num_round,nfold=n_fold)
cvresult2 = xgb.cv(param2,dfull2,num_boost_round=num_round,nfold=n_fold)
CPU times: user 6.33 s, sys: 54 ms, total: 6.39 s
Wall time: 817 ms
plt.figure(figsize=(20,5))
plt.plot(range(1,101),cvresult1.iloc[:,0],c="red",label="train,gamma = 0")
plt.plot(range(1,101),cvresult1.iloc[:,2],c="orange",label="test,gamma = 0")
plt.plot(range(1,101),cvresult2.iloc[:,0],c="green",label="train,gamma = 0.5")
plt.plot(range(1,101),cvresult2.iloc[:,2],c="blue",label="test,gamma = 0.5")
plt.legend()
plt.show()
4.1过拟合:剪枝参数与回归模型调参
作为天生过拟合的模型,XGBoost应用的核心之一就是减轻过拟合带来的影响。作为树模型,减轻过拟合的方式主要
是靠对决策树剪枝来降低模型的复杂度,以求降低方差。在之前的讲解中,我们已经学习了好几个可以用来防止过拟
合的参数,包括上一节提到的复杂度控制 ,正则化的两个参数 和 ,控制迭代速度的参数 以及管理每次迭代前进
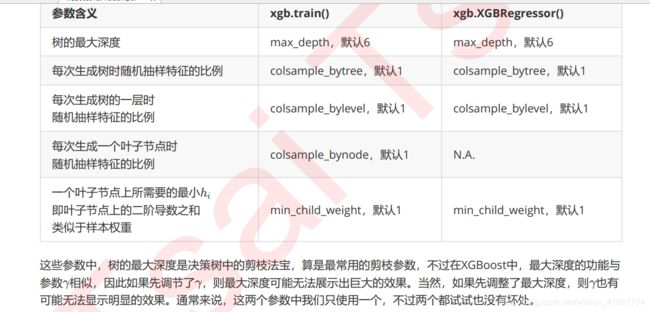
行的随机有放回抽样的参数subsample。所有的这些参数都可以用来减轻过拟合。但除此之外,我们还有几个影响重大的,专用于剪枝的参数:
通常当我们获得了一个数据集后,我们先使用网格搜索找出比较合适的n_estimators和eta组合,然后使用gamma或
者max_depth观察模型处于什么样的状态(过拟合还是欠拟合,处于方差-偏差图像的左边还是右边?),最后再决
定是否要进行剪枝。通常来说,对于XGB模型,大多数时候都是需要剪枝的。接下来我们就来看看使用xgb.cv这个类
来进行剪枝调参,以调整出一组泛化能力很强的参数。
params1 = {
    'silent':True,
    'obj':'reg:linear',
    'subsample':1,
    'max_depth':6,
    'eta':0.3,
    'gamma':0,
    'lambda':1,
    'alpha':0,
    'colsample_bytree':1,
    'colsample_bylevel':1,
    'colsample_bynode':1,
    'nfold':5

}
num_round = 100
cvresult1 = xgb.cv(params1,dfull,num_round)
fig,ax = plt.subplots(1,figsize=(20,5))
ax.set_ylim(top = 5)
ax.grid()

# ax.plot(range(1,101),cvresult2.iloc[:,0],c="green",label="train,gamma = 0.5")
# ax.plot(range(1,101),cvresult2.iloc[:,2],c="blue",label="test,gamma = 0.5")
ax.legend()
plt.show()
params2 = {
    'silent':True,
    'obj':'reg:linear',
    'nfold':5 ,
    'max_depth':2,
    'eta':0.5,
    'gamma':0

}
params3 = {
    'silent':True,
    'obj':'reg:linear',
    'max_depth':2,
    'eta':0.05,
    'nfold':5,
#     'gamma':5

}
num_round = 100
cvresult2 = xgb.cv(params2,dfull,num_round)
cvresult3 = xgb.cv(params3,dfull,num_round)
fig,ax = plt.subplots(1,figsize=(20,5))
ax.set_ylim(top = 5)
ax.grid()
# ax.plot(range(1,101),cvresult1.iloc[:,0],c="grey",label="train,original")
# ax.plot(range(1,101),cvresult1.iloc[:,2],c="pink",label="test,original")
ax.plot(range(1,101),cvresult2.iloc[:,0],c="red",label="train,last")
ax.plot(range(1,101),cvresult2.iloc[:,2],c="orange",label="test,;last")
ax.plot(range(1,101),cvresult3.iloc[:,0],c="green",label="train,this")
ax.plot(range(1,101),cvresult3.iloc[:,2],c="blue",label="test,this")
ax.legend(fontsize = 'xx-large')
plt.show()
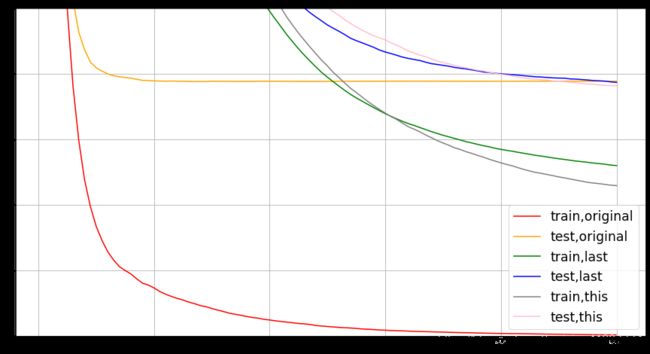
# 大佬调参结果
param1 = {'silent':True
          ,'obj':'reg:linear'
          ,"subsample":1
          ,"max_depth":6
          ,"eta":0.3
          ,"gamma":0
          ,"lambda":1
          ,"alpha":0
          ,"colsample_bytree":1
          ,"colsample_bylevel":1
          ,"colsample_bynode":1
          ,"nfold":5}
num_round = 100

time0 = time()
cvresult1 = xgb.cv(param1, dfull, num_round)
print(datetime.datetime.fromtimestamp(time()-time0).strftime("%M:%S:%f"))

fig,ax = plt.subplots(1,figsize=(15,8))
ax.set_ylim(top=5)
ax.grid()
ax.plot(range(1,101),cvresult1.iloc[:,0],c="red",label="train,original")
ax.plot(range(1,101),cvresult1.iloc[:,2],c="orange",label="test,original")

param2 = {'silent':True
          ,'obj':'reg:linear'
          ,"max_depth":2
          ,"eta":0.05
          ,"gamma":0
          ,"lambda":1
          ,"alpha":0
          ,"colsample_bytree":1
          ,"colsample_bylevel":0.4
          ,"colsample_bynode":1
          ,"nfold":5}

param3 = {'silent':True
          ,'obj':'reg:linear'
          ,"subsample":1
          ,"eta":0.05
          ,"gamma":20
          ,"lambda":3.5
          ,"alpha":0.2
          ,"max_depth":4
          ,"colsample_bytree":0.4
          ,"colsample_bylevel":0.6
          ,"colsample_bynode":1
          ,"nfold":5}

time0 = time()
cvresult2 = xgb.cv(param2, dfull, num_round)
print(datetime.datetime.fromtimestamp(time()-time0).strftime("%M:%S:%f"))

time0 = time()
cvresult3 = xgb.cv(param3, dfull, num_round)
print(datetime.datetime.fromtimestamp(time()-time0).strftime("%M:%S:%f"))

ax.plot(range(1,101),cvresult2.iloc[:,0],c="green",label="train,last")
ax.plot(range(1,101),cvresult2.iloc[:,2],c="blue",label="test,last")
ax.plot(range(1,101),cvresult3.iloc[:,0],c="gray",label="train,this")
ax.plot(range(1,101),cvresult3.iloc[:,2],c="pink",label="test,this")
ax.legend(fontsize="xx-large")
plt.show()
4.2XGBOOST模型的保存和调用
使用Python进行编程时,希望将训练完毕的模型保存下来,以便日后用于新的数据集。在python中,保存模型的方法有很多中。以XGB为例,两种主要的模型保存和调用方法。
4.2.1使用Pickle保存和调用模型
pickle是python编程中比较标准的一个保存和调用模型的库,我们可以使用pickle和open函数的连用,来将我们的模型保存到本地。
from sklearn.datasets import load_boston
from sklearn.model_selection import train_test_split as TTS
from sklearn.metrics import mean_squared_error as MSE
boston_data = load_boston()
x_all = boston_data.data
y_all = boston_data.target
x_train,x_valid1,y_train,y_valid = TTS(x_all,y_all,random_state = 2020,test_size = 0.1)
print(x_train.shape,x_valid.shape,y_train.shape,y_valid.shape)
(455, 13) (51, 13) (455,) (51,)
import pickle
dtrain = xgb.DMatrix(x_train,y_train)
param1 = {'silent':True
          ,'obj':'reg:linear'
          ,"subsample":1
          ,"max_depth":6
          ,"eta":0.3
          ,"gamma":0
          ,"lambda":1
          ,"alpha":0
          ,"colsample_bytree":1
          ,"colsample_bylevel":1
          ,"colsample_bynode":1
          ,"nfold":5}
num_round = 100

time0 = time()
clf = xgb.train(param1, dtrain, num_round)
print(datetime.datetime.fromtimestamp(time()-time0).strftime("%M:%S:%f"))
[17:18:05] WARNING: /workspace/src/learner.cc:480:
Parameters: { nfold, obj, silent } might not be used.

  This may not be accurate due to some parameters are only used in language bindings but
  passed down to XGBoost core.  Or some parameters are not used but slip through this
  verification. Please open an issue if you find above cases.


00:00:156627
dtest = xgb.DMatrix(x_valid,y_valid)
pickle.dump(clf,open('xgboostonbostion.dat','wb'))
# 导入模型
loaded_model = pickle.load(open('xgboostonbostion.dat','rb'))
preds = loaded_model.predict(dtest)
MSE(preds,y_valid)
9.68693440869766
from sklearn.metrics import r2_score
r2_score(preds,y_valid)
0.8220975604535214
4.2.2使用joblib保存和调用模型
import joblib

#同样可以看看模型被保存到了哪里
joblib.dump(bst,"xgboost-boston.dat")
loaded_model = joblib.load("xgboost-boston.dat")
