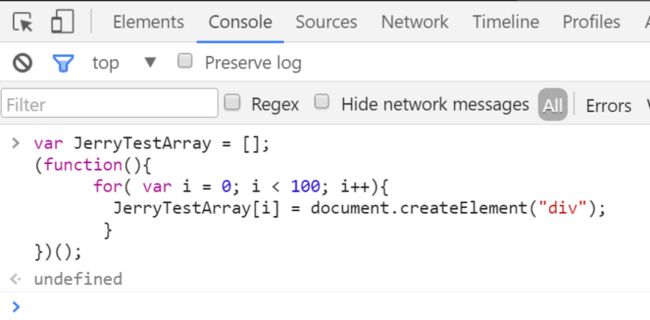
I use the following simple JavaScript code to illustrate:
var JerryTestArray = [];
(function(){
      for( var i = 0; i < 100; i++){
        JerryTestArray[i] = document.createElement("div");
       }
})();
Create a new empty tab in your Chrome, and first create a snapshot with empty heap status by click “Take Snapshot” button:
The Snapshot1 is generated.
Now switch to tab Console, paste the JavaScript code and execute it in console.
And switch to Profiles tab again to make the second snapshot:
Once done, select the second snapshot, choose “Comparison” and “Snapshot1” as filter:
We can find out from column “New” that 100 div nodes are created as we expect.
Since these nodes are not appended to document node so they are invisible to end user, so displayed as “Detached DOM”. The JerryTestArray still holds the reference to each div node so Garbage collector will not touch these nodes.
In order to make Garbage collector recycle the memory occupied by these nodes, just assign another value to JerryTestArray in console:
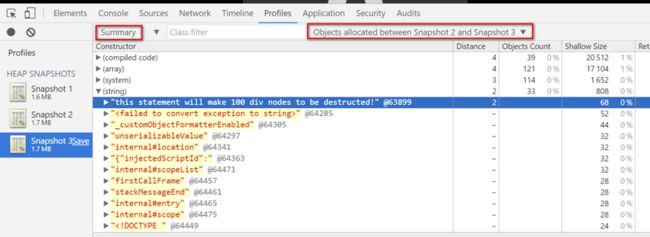
Once done, make the third snapshot and compare it with the second. Now we can find that the re-assignment to JerryTestArray will trigger the destruction of those 100 div nodes by Garbage collector:
Meanwhile, the string we use in assignment could also be inspected via the combination of filters below:
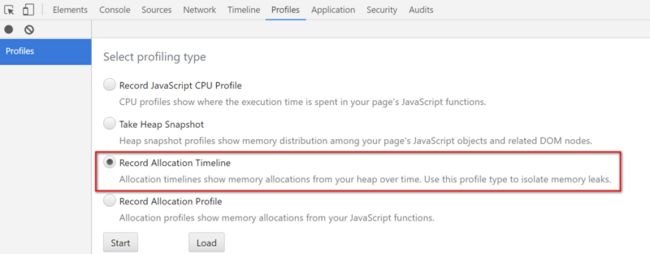
There is another kind of profile in Chrome development tool which can give you an overview about timeline of memory allocation:
Click Start button in above screenshot, and paste the following code in console and executed:
var JerryTestArray = [];
(function(){
      for( var i = 0; i < 98; i++){
        JerryTestArray[i] = document.createElement("span");
        JerryTestArray[i].className = "JerryClassName" + i;
       }
})();
After the code is executed, paste the following code and execute:
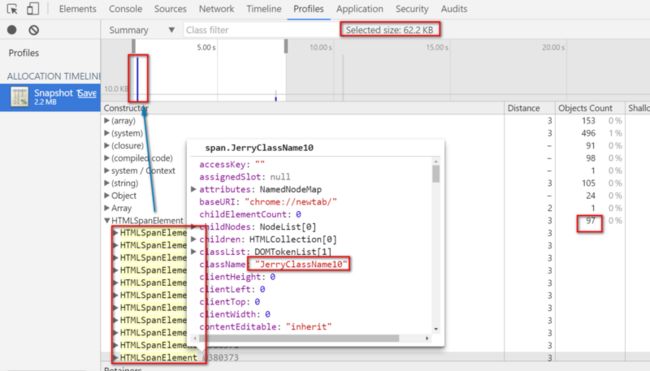
JerryTestArray[30] = "this is a long test............................end";Now stop the profile. The profile is displayed as below. The highlighted vertical blue line indicates the timeslot when the 97 Span elements are created. Note that the number of Span elements displayed here is not 98 but 97 since Chrome development tool displays the final status of objects after “stop profile” button is clicked ( the reference to 30th Span element is replaced by String, so it is recycled by GC ).
You can drag the two vertical bars to define the time range between which you would like to inspect. For example the time range below contains the timeslot when the below assignment occurs:
JerryTestArray[30] = "this is a long test............................end";With this gained knowledge now we can check the memory allocation and destruction in some real application. For example click tile “My Tasks” to enter this application, make the first snapshot and click back button within application to return to launchpad, and make the second snapshot and review the comparison result.
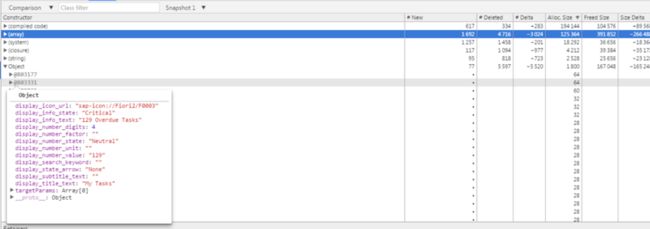
From the result we find out lots of stuff are deleted after we return to launchpad:
Hover your mouse to a given destructed object and you can review its detail:
For more tips How I use Chrome development tool in my daily work, please refer to this blog Chrome Development Tool tips used in my daily work
要获取更多Jerry的原创文章,请关注公众号"汪子熙":![]()


