Qt5--QcustomPlot使用实时动态显示总结
序言
一般来说,要想动态显示需要利用定时器进行数据更新。
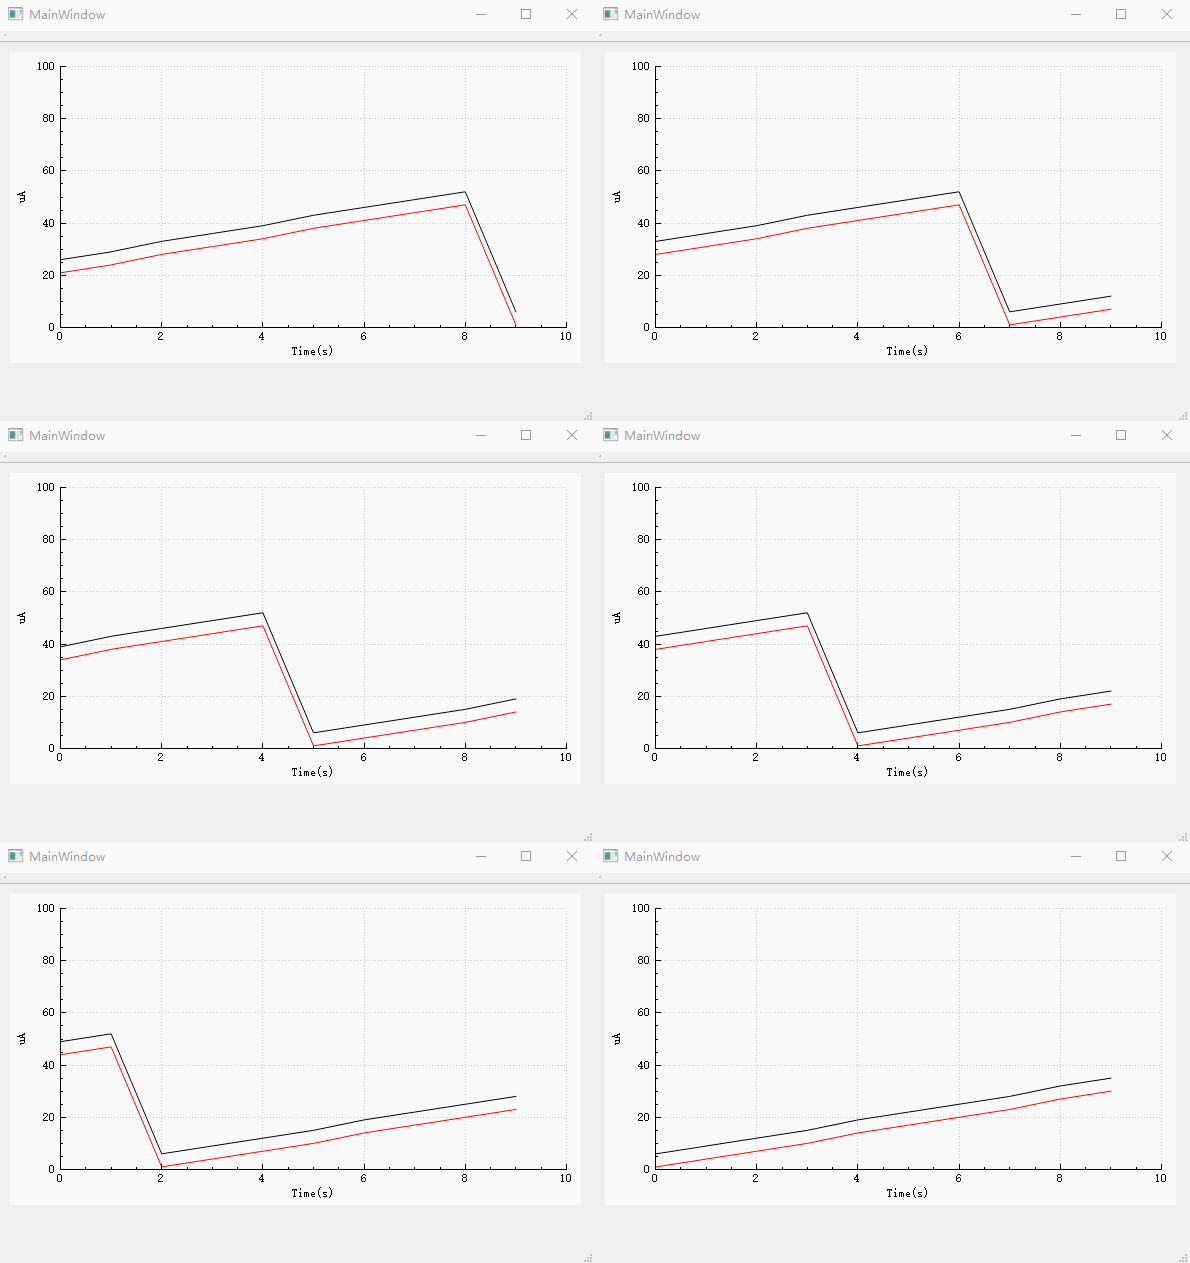
- 动态显示–模拟数据–X轴固定时间
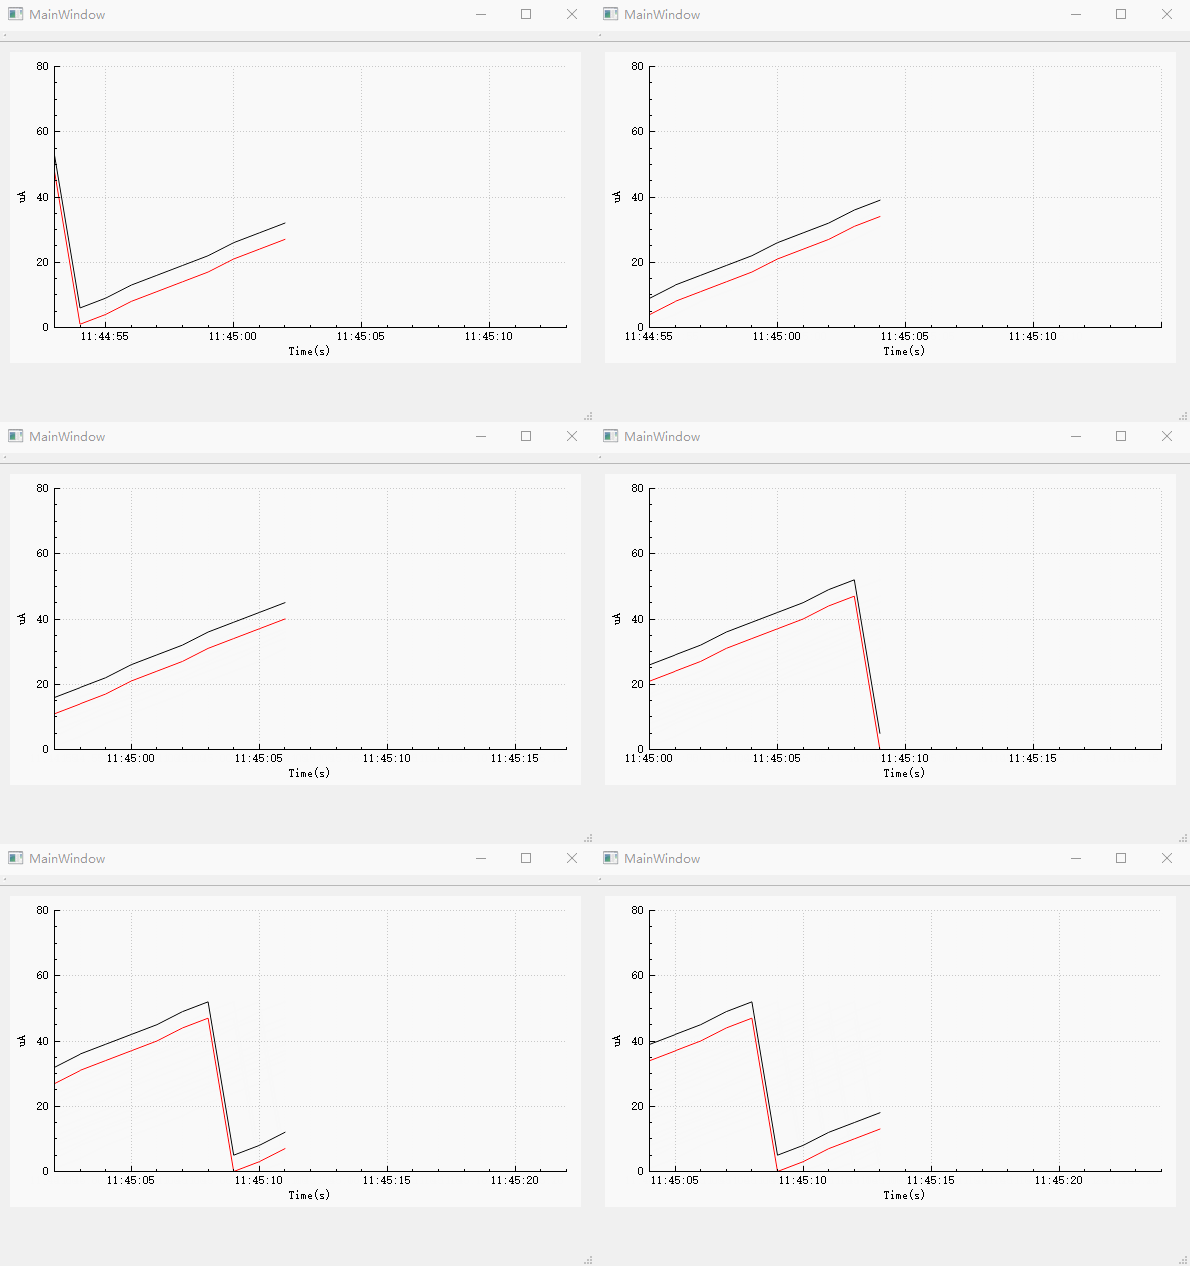
- 动态显示–模拟数据–X轴滚动时间
动态显示–模拟数据–非真实时间
mainwindows.cpp
#include "mainwindow.h"
#include "ui_mainwindow.h"

MainWindow::MainWindow(QWidget *parent) :
    QMainWindow(parent),
    ui(new Ui::MainWindow)
{
    ui->setupUi(this);

    QTimer *timer = new QTimer(this);
    timer->start(1000);
    connect(timer,SIGNAL(timeout()),this,SLOT(Time_Update()));
}

MainWindow::~MainWindow()
{
    delete ui;
}

void MainWindow::Time_Update(void)
{
    QTime t;
    t=QTime::currentTime();
    qsrand(QTime(0, 0, 0).secsTo(QTime::currentTime()));
    cnt=qrand()%50;
    Show_Plot(ui->widget);
}

void MainWindow::Show_Plot(QCustomPlot *customPlot)
{
    QVector<double> key(10);
    QVector<double> value(10);
    QVector<double> value2(10);


    for(int i=0; i<9; i++)
    {
        num[i] = num[i+1];
    }
    num[9] = cnt;
    for(int i=0;i<10;i++)
    {
        key[i]   = i;
        value[i]  = num[i];
        value2[i]  = num[i]+5;
    }
    customPlot->addGraph();
    customPlot->graph(0)->setPen(QPen(Qt::red));
    customPlot->graph(0)->setData(key,value);

    customPlot->addGraph();
    customPlot->graph(1)->setPen(QPen(Qt::black));
    customPlot->graph(1)->setData(key,value2);

    customPlot->xAxis->setLabel("Time(s)");
    customPlot->yAxis->setLabel("uA");

    customPlot->xAxis->setRange(0,10);
    customPlot->yAxis->setRange(0,100);
    customPlot->replot();
}
mainwindow.h
#ifndef MAINWINDOW_H
#define MAINWINDOW_H
#include 动态显示–模拟数据–X轴滚动时间
mainwindow.cpp
#include "mainwindow.h"
#include "ui_mainwindow.h"

MainWindow::MainWindow(QWidget *parent) :
    QMainWindow(parent),
    ui(new Ui::MainWindow)
{
    ui->setupUi(this);

    QTimer *timer = new QTimer(this);
    timer->start(1000);
    connect(timer,SIGNAL(timeout()),this,SLOT(Time_Update2()));
}

MainWindow::~MainWindow()
{
    delete ui;
}

void MainWindow::Time_Update(void)
{
    QTime t;
    t=QTime::currentTime();
    qsrand(QTime(0, 0, 0).secsTo(QTime::currentTime()));
    cnt=qrand()%50;
    Show_Plot2(ui->widget);
}

void MainWindow::Show_Plot(QCustomPlot *customPlot)
{
    QVector<double> key(10);
    QVector<double> value(10);
    QVector<double> value2(10);
    double now = QDateTime::currentDateTime().toTime_t();
    srand(8);

    for(int i=0; i<9; i++)
    {
        num[i] = num[i+1]; // 长江后浪推前浪:前消后加
    }
    num[9] = cnt;  // 更新的值加在后面
    for(int i=0;i<10;i++)
    {
        key[i]   = now+i;
        value[i]  = num[i];
        value2[i]  = num[i]+5;
    }
    customPlot->addGraph();
    customPlot->graph(0)->setPen(QPen(Qt::red));
    customPlot->graph(0)->setData(key,value);

    customPlot->addGraph();
    customPlot->graph(1)->setPen(QPen(Qt::black));
    customPlot->graph(1)->setData(key,value2);


    QSharedPointer<QCPAxisTickerDateTime> dateTicker(new QCPAxisTickerDateTime);
    dateTicker->setDateTimeFormat("hh:mm:ss"); // yyyy-MM-dd hh:mm:ss
    customPlot->xAxis->setTicker(dateTicker);
    //customPlot->xAxis->setTickLabelRotation(30); // 设置30斜着显示

    customPlot->xAxis->setLabel("Time(s)");
    customPlot->yAxis->setLabel("uA");

    customPlot->xAxis->setRange(now, now+20);
    customPlot->yAxis->setRange(0,80);
    customPlot->replot();
}
mainwindow.h
#ifndef MAINWINDOW_H
#define MAINWINDOW_H
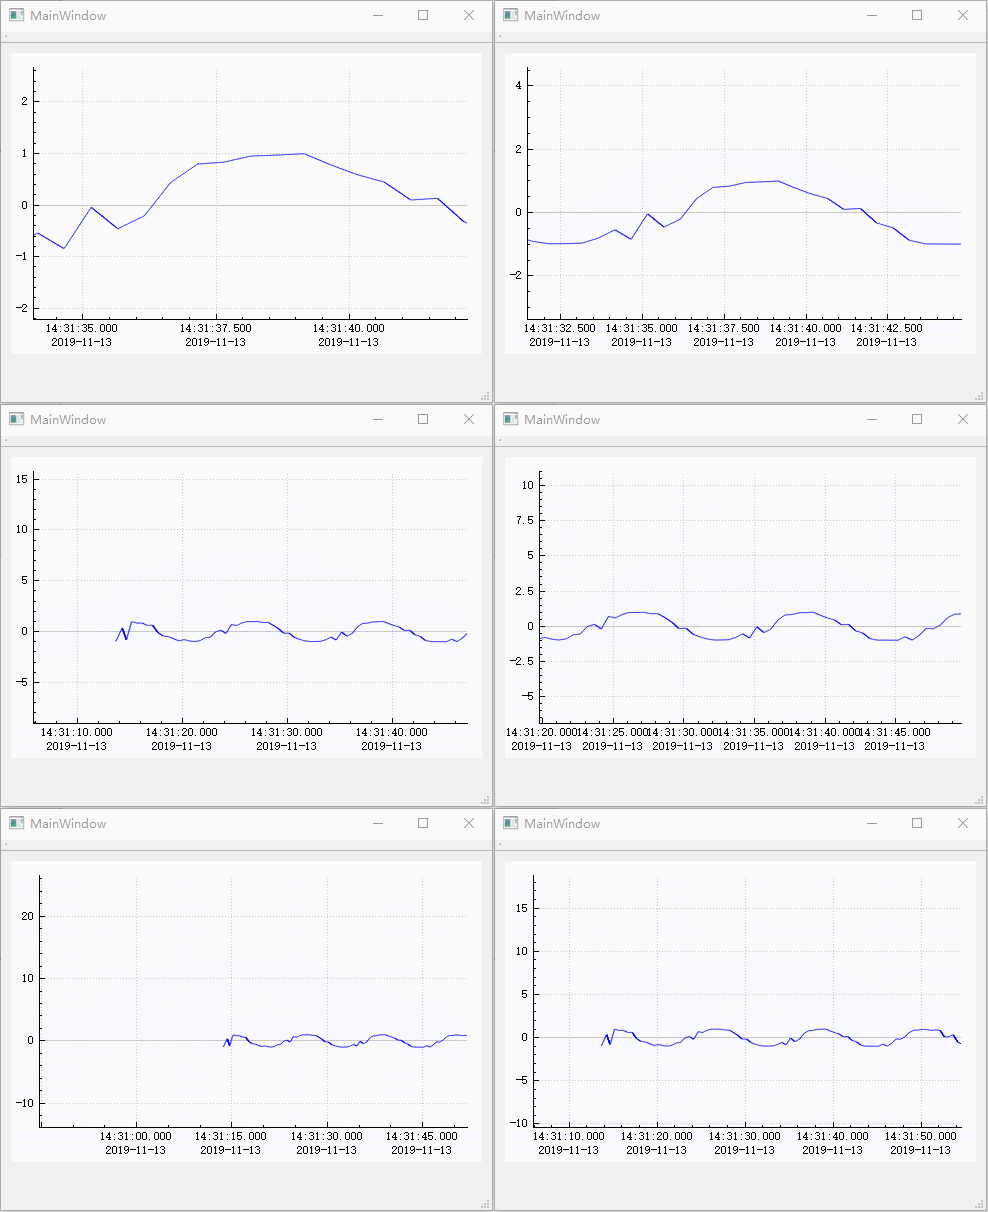
#include 最好的一个状态
#include "mainwindow.h"
#include "ui_mainwindow.h"


MainWindow::MainWindow(QWidget *parent) :
    QMainWindow(parent),
    ui(new Ui::MainWindow)
{
    ui->setupUi(this);
    cnt = 0;

    QSharedPointer<QCPAxisTickerDateTime> dateTicker(new QCPAxisTickerDateTime);//日期做X轴
    dateTicker->setDateTimeFormat("hh:mm:ss.zzz\nyyyy-MM-dd");//日期格式(可参考QDateTime::fromString()函数)
    ui->plot->xAxis->setTicker(dateTicker);//设置X轴为时间轴
    ui->plot->xAxis->setTickLabels(true);//显示刻度标签

    ui->plot->addGraph(ui->plot->xAxis, ui->plot->yAxis);

    ui->plot->setInteractions(QCP::iRangeDrag //可平移
                            | QCP::iRangeZoom //可滚轮缩放
                            | QCP::iSelectLegend );//可选中图例
    ui->plot->yAxis->setRange(-1.5, 1.5);


    refreshTimer = startTimer(30, Qt::CoarseTimer);
    sampleTimer = startTimer(500, Qt::CoarseTimer);

    tLast = getNow();

    lastPoint.setX(getNow());
    lastPoint.setY(qSin(lastPoint.x()));
}

void MainWindow::timerEvent(QTimerEvent *event)
{
    Q_UNUSED(event);

    if(event->timerId() == refreshTimer)//30ms
    {
        double xHigh = getNow() - 0.5;
        ui->plot->xAxis->setRange(xHigh - ui->plot->xAxis->range().size(), xHigh);
        ui->plot->replot();
    }


    if(event->timerId() == sampleTimer)//500ms
    {
        newPoint.setX(getNow());
        newPoint.setY(qSin(100 * lastPoint.x()));//模拟收到新的采样点
        cnt = 0;
        qDebug() << newPoint.x() <<  newPoint.y();

        /*在新的点和上一个采样点之间,线性插值100个点,但并不立即显示*/
        /*这里以线性插值为例。其余类型的插值只需替换这一部分即可*/
        int n = 100;
        double dx = (newPoint.x() - lastPoint.x()) / 100.0;//线性插值
        double dy = (newPoint.y() - lastPoint.y()) / 100.0;//线性插值
        for(int i = 1; i <= n; i++)
        {
            ui->plot->graph(0)->addData(lastPoint.x() + dx * i, lastPoint.y() + dy * i);
        }
        lastPoint.setX(newPoint.x());
        lastPoint.setY(newPoint.y());
    }
}

double MainWindow::getNow()
{
    return (double)(QDateTime::currentMSecsSinceEpoch()) / 1000.0;
}


MainWindow::~MainWindow()
{
    delete ui;
}
mainwindow.h
#ifndef MAINWINDOW_H
#define MAINWINDOW_H
#include 

