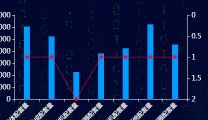
Echarts双Y轴折线图和柱形图混合
柱形图和折线图混合使用,并且使用双y轴坐标
具体代码如下
option ={
	color: ['#009CFF', '#FF072F'],  //设置多个颜色值时代表的是图例颜色
      tooltip: {
        trigger: 'axis',
        axisPointer: {
          type: 'line',
        },
      },
      legend: {
        right: '5%',
        bottom: '0',
        data: ['产品(辆)', '排名'],
        textStyle: {
          fontSize: 14,
          fontWeight: 'normal',
        },
      },
      grid: {
        left: '15%',
        bottom: '40%',
        top: '8%',
      },
      xAxis: [
        {
          type: 'category',
          data: industryName,
          textStyle: {
            fontWeight: 'normal',
          },
          axisLabel: {
            textStyle: {
              fontSize: 12,
              fontWeight: 'normal',
            },
            rotate: '45',
          },
        },
      ],
      yAxis: [   //当有两个y轴时,设置两个{}{}来承载y轴的值
        {
          type: 'value',
          min: 0,
          axisLabel: {
            textStyle: {
              fontSize: 14,
              fontWeight: 'normal',
            },
          },
          splitLine: { show: false },  //y轴网格线,一般都会隐藏,x轴亦是如此

        },
        {
          type: 'value',
          axisLabel: {
            textStyle: {
              fontSize: 14,
              fontWeight: 'normal',
            },
          },
          splitLine: { show: false },
          inverse: true,
        },
      ],
      series: [    //对应折线图和柱形图,进行数据加载
        {
          name: '产品(辆)',
          type: 'bar',
          data: industryValue,
          barWidth: '12',
        },
        {
          name: '排名',
          type: 'line',
          yAxisIndex: 1,
          data: industryPM,
          label: {
            normal: {
              show: false,
            },
          },
          lineStyle: {
            normal: {
              width: 1,
            },
          },
        },
      ],
}
