python数据可视化入门(八):子图划分
subplot()绘制子图
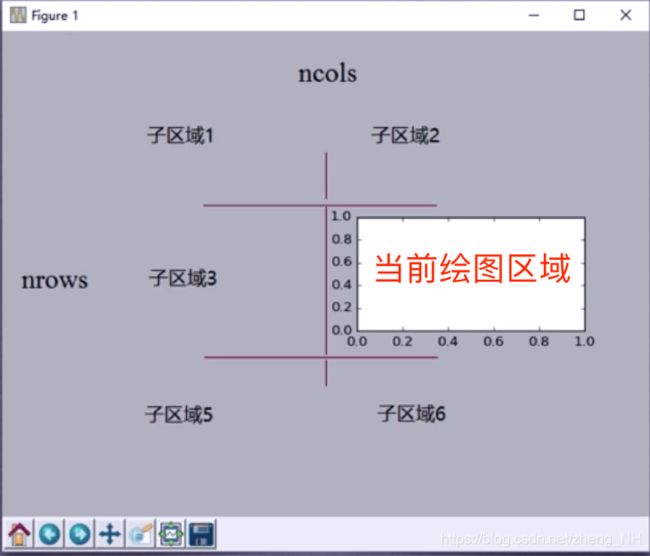
函数:plt.subplot(numRows,numCols,plotNums)
plt.subplot(3,2,4)设置3*2个子图,并指定第4个
plt.subplot(324) 3行 2列
在全局绘图区域中创建一个分区体系,并定位到一个子绘图区域!
示例
import matplotlib.pyplot as plt

import numpy as np


fig = plt.figure()

#第一种

'''

fig.add_subplot(221)

fig.add_subplot(222)

fig.add_subplot(223)

fig.add_subplot(224)

'''

#第二种

'''

ax = fig.subplots(2,2)

ax[0,0].scatter([1,2],[3,4])

ax[0,1].plot([1,2],[3,4])

ax[1,0].bar([1,2],[3,4],0.4)

ax[1,1].barh([1,2],[3,4],0.4)

'''

#第三种 add_axes()

x=np.arange(-2*np.pi,2*np.pi)

y=np.sin(x)

y1=np.cos(x)

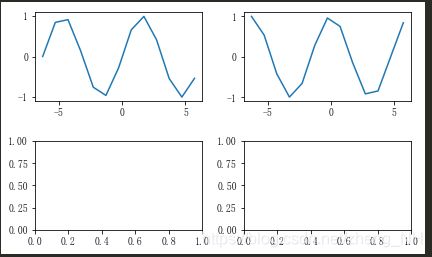
fig.add_subplot(221)

plt.plot(x,y)

fig.add_subplot(222)

plt.plot(x,y1)

fig.add_subplot(223)

fig.add_subplot(224)

#画布间距,值在0-1之间

plt.subplots_adjust(left=0.03,right=0.9,wspace=0.25,hspace=0.45)
不规则子图划分
函数plt.subplot2grid(GridSpec, CurSpec, colspan=1, rowspan=1)
示例
import matplotlib.pyplot as plt

import numpy as np

import matplotlib.gridspec as gridspec


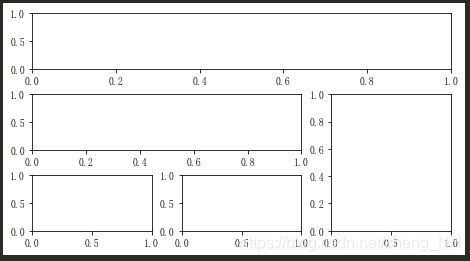
gs = gridspec.GridSpec(3,3)


#第一行所有列

ax1 = plt.subplot(gs[0,:])

#二行,1,2列

ax2 = plt.subplot(gs[1,:2])

#-1就是最后一列  :-1就是除了最后一列

#ax3 = plt.subplot(gs[1,:-1])

ax4 = plt.subplot(gs[1:,-1])

ax5 = plt.subplot(gs[2,0])

ax6 = plt.subplot(gs[2,1])

#画布间距,值在0-1之间

plt.subplots_adjust(left=0.03,right=1,wspace=0.25,hspace=0.45)
共享坐标轴
1共享单一绘图区域的坐标轴
ax.twinx() 实现共享x轴
ax.twiny() 实现共享y轴
示例
import numpy as np

import matplotlib.pyplot as plt

#设置中文显示

plt.rcParams["font.sans-serif"] = ["LiSu"]

plt.rcParams["axes.unicode_minus"] = False

fig, ax1 = plt.subplots()


t = np.arange(0.05, 10., 0.01)

s1 = np.exp(t)

ax1.plot(t, s1, c="b", ls="-")


ax1.set_xlabel("x坐标轴")

ax1.set_ylabel("以e为底的指数", color="b")

ax1.tick_params("y", colors="b")

#共享x轴

ax2 = ax1.twinx()

s2 = np.cos(t ** 2)

ax2.plot(t, s2, c="r", ls=":")


ax2.set_ylabel("余弦函数", color="r")

ax2.tick_params("y", colors="r")
2共享不同子区绘图区域的坐标轴
- 当fig,ax = plt.subplots(2,2,sharex="all")时。
- 若sharex="all",4幅图的横坐标都采用了同一个坐标范围;
- 若sharey="all",4幅图的纵坐标都采用了同一个坐标范围
- 当fig,ax = plt.subplots(2,2,sharex="none")时等价于
fig,ax = plt.subplots(2,2)本身,不共享任何坐标。
- 当fig,ax = plt.subplots(2,2,sharex="row")时,每一行的子分区共享横坐标。
- 当fig,ax = plt.subplots(2,2,sharex="col")时,每一列的子分区共享横坐标。
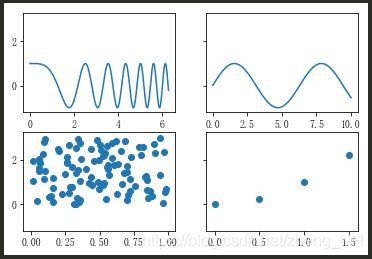
- 共享不同子区绘图区域的坐标轴的方法是subplots(2, 2, sharey=True),
- sharey=True是一区,二区共享y轴,还有其他参数,row,col,all,none,
- 其中all和none分别等同True和False。
import numpy as np

import matplotlib.pyplot as plt

#设置中文显示

plt.rcParams["font.sans-serif"] = ["LiSu"]

plt.rcParams["axes.unicode_minus"] = False

#数据准备

x1 = np.linspace(0, 2 * np.pi, 400)

y1 = np.cos(x1 ** 2)

x2 = np.linspace(0.01, 10, 100)

y2 = np.sin(x2)

x3 = np.random.rand(100)

y3 = np.linspace(0, 3, 100)

x4 = np.arange(0, 2, 0.5)

y4 = np.power(x4, 2)

#共享y轴

fig, ax = plt.subplots(2, 2,sharey=True)


ax1 = ax[0, 0]

ax1.plot(x1, y1)

ax2 = ax[0, 1]

ax2.plot(x2, y2)

ax3 = ax[1, 0]

ax3.scatter(x3, y3)

ax4 = ax[1, 1]

ax4.scatter(x4, y4)


plt.show()
3除去各子图间的空隙
示例
import numpy as np

import matplotlib.pyplot as plt

#设置中文显示

plt.rcParams["font.sans-serif"] = ["LiSu"]

plt.rcParams["axes.unicode_minus"] = False

x = np.linspace(0.0,10.0,200)

y1 = np.cos(x)*np.sin(x)

y2 = np.exp(-x)*np.sin(x)

y3 = 3*np.sin(x)

y4 = np.power(x,0.5)


# 通过sharex="all"实现X轴坐标共享

fig,(ax1,ax2,ax3,ax4) = plt.subplots(4,1,sharex="all")


# 将4幅图水平区域的空隙去掉

fig.subplots_adjust(hspace=0)


ax1.plot(x,y1,ls="-",lw=2,c="b")

ax1.set_yticks(np.arange(-0.6,0.7,0.2))

ax1.set_ylim(-0.7,0.7)


ax2.plot(x,y2,ls="-",lw=2,c="r")

ax2.set_yticks(np.arange(-0.05,0.36,0.1))

ax2.set_ylim(-0.1,0.4)


ax3.plot(x,y3,ls="-",lw=2,c="g")

ax3.set_yticks(np.arange(-3,4,1))

ax3.set_ylim(-3.5,3.5)


ax4.plot(x,y4,ls="-",lw=2,c="c")

ax4.set_yticks(np.arange(0.0,3.6,0.5))

ax4.set_ylim(0.0,4.0)


plt.show()


