Earth Engine下长时间序列监测
巨流河是清代称呼辽河的名字,她是中国七大江河之一,辽宁百姓的母亲河。哑口海位于台湾南端,是鹅銮鼻灯塔下的一泓湾流,据说汹涌海浪冲击到此,声消音灭。
本次将以哑口海周边区域为对象,研究该海岸近30年来的变化趋势。
为求简便,只取了1988,1998,2008和2018的典型无云影像来分析,如果需要精准研究的话就要取很长的时间序列来研究了。具体过程也只涵盖了随机森林分类,植被NDVI计算和建筑区求像元数。其中勾选的训练样区应该在30年内均无变化或为同一地物,如果变化大则需要对每年的影像建立单独的训练样本。
之前想一起把趋势图画了,但现成的ui.Chart.image.byClass()只能对单景影像画图,而ui.Chart()里面的数据又需要为number类型,花了好长时间也没能将计算出的Number Object类型转换为number类型,所以就只有将就用List看一下了,况且科学的图表还是其他软件在行。
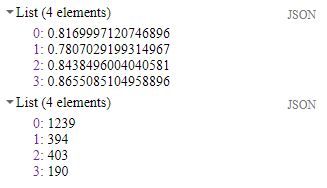
计算结果如下图,第一个List表示每年的植被区域NDVI值,第二个List表示每年的建筑区像元数,单像元均为0.09公顷。简单结论:在1988-1998,2008-2018年间该地区为适应旅游规划或生态建设,持续将建筑区规划为绿地;近30年来,绿地的护养情况也得到了提高。(1998的研究影像成像于11月,处于秋末冬初季,略小于1988年的8月或为正常现象)
 计算结果
计算结果
代码如下(第66行为代码开始的地方,前面为研究区和训练区):
var veg = /* color: #98ff00 */ee.Feature(
        ee.Geometry.MultiPoint(
            [[120.8596453364878, 21.902058426152273],
             [120.8572849925547, 21.913644945654127],
             [120.85393759570411, 21.91205235278763],
             [120.85831496081641, 21.901062976747287],
             [120.85196348986915, 21.90870784980892],
             [120.85041853747657, 21.91475975006526],
             [120.85792872271827, 21.90504473264743]]),
        {
          "region": 0,
          "system:index": "0"
        }),
    bld = /* color: #0b4a8b */ee.Feature(
        ee.Geometry.MultiPoint(
            [[120.8525004546998, 21.903887372630997],
             [120.8534016769288, 21.904882802307007],
             [120.85129882506112, 21.90540042299038],
             [120.85224296263436, 21.902055763858968],
             [120.85121299437264, 21.904723534026147],
             [120.85494662932138, 21.917026484354032],
             [120.8539595764039, 21.91762368790777],
             [120.84803725889901, 21.912965433772182],
             [120.85001136473397, 21.90719217237422],
             [120.85198547056893, 21.905718957860927],
             [120.85155631712655, 21.904683716928112]]),
        {
          "region": 1,
          "system:index": "0"
        }),
    yakouSea = /* color: #ffc82d */ee.Geometry.Polygon(
        [[[120.84563635671248, 21.91545161669814],
          [120.84649466359724, 21.915133103589817],
          [120.8470096477281, 21.9148942182911],
          [120.84726713979353, 21.9144164464916],
          [120.84765337789167, 21.913938673089387],
          [120.84778212392439, 21.91302293625539],
          [120.84773920858015, 21.912067378499433],
          [120.84782503926863, 21.91095255301553],
          [120.84782503926863, 21.908882139683847],
          [120.84769629323591, 21.907727473025293],
          [120.84799670064558, 21.906453347231466],
          [120.84825419271101, 21.90553756227942],
          [120.84902238083521, 21.905473842432095],
          [120.8495802803103, 21.905075673047698],
          [120.84885071945826, 21.904438599718425],
          [120.84855031204859, 21.90384134088545],
          [120.84885071945826, 21.901890277919467],
          [120.84975194168726, 21.900138280249525],
          [120.85142564011255, 21.899262273338277],
          [120.85318516922632, 21.898067709782673],
          [120.85696171951929, 21.897788976845863],
          [120.85957955551783, 21.897709338763818],
          [120.8622403068606, 21.89834644217444],
          [120.86331319046656, 21.899142817433216],
          [120.86365651322046, 21.900815190993278],
          [120.86365651322046, 21.901930095798022],
          [120.86202573013941, 21.9035228018176],
          [120.86026620102564, 21.90615072783202],
          [120.85940789414087, 21.90822118085846],
          [120.8596653862063, 21.911486064880044],
          [120.8602232856814, 21.915029573828004],
          [120.85893582535425, 21.916900829498537],
          [120.85773419571558, 21.91877206058061],
          [120.85679005814234, 21.92112101798072]]]);

/*
 * Monitering Yakou Sea Area
 * on Vegtaion and Buildings
 * in 1988 to 2018
 *
 * Author: Deserts Tsung, Nov 19,2018
 * Chengdu University of Information Technology
 *
*/


// Variables Could Use Widely
var NDVI = [0,0,0,0], // NDVI of Vegtation in 4 Years
    BLDAREA = [0,0,0,0], // Area of Buildings in 4 Years
    bands5 = ['B1','B2','B3','B4','B5','B7'], // Bands to be Used in Classification of Landsat-5
    bands8 = ['B1','B2','B3','B4','B5','B6','B7'], // Bands to be Used in Classification of Landsat-8
    trainroi = ee.FeatureCollection(bld)
                 .merge(ee.FeatureCollection(veg)); // Training Regions of Classification

// Begin for
for (var i=0;i<3;i++) {

  if (i === 0) {
    var img80s = ee.Image('LANDSAT/LT05/C01/T1_SR/LT05_117045_19880801').clip(yakouSea);
  } else if (i === 1) {
    var img80s = ee.Image('LANDSAT/LT05/C01/T1_SR/LT05_117045_19981101').clip(yakouSea);
  } else if (i === 2) {
    var img80s = ee.Image('LANDSAT/LT05/C01/T1_SR/LT05_117045_20080824').clip(yakouSea);
  } // Select one of These Images to Compute

var training80s = img80s.select(bands5).sampleRegions({
          collection:trainroi,
          properties:['region'],
          scale:30
      }),
      classifier80s = ee.Classifier.randomForest().train({
          features:training80s,
          classProperty:'region',
          inputProperties:bands5
      }),
      cls80s = img80s.select(bands5).classify(classifier80s); // Classification Above

var   mask_veg80s = cls80s.eq(0),
      veg80s = img80s.normalizedDifference(['B4', 'B3']).updateMask(mask_veg80s);
      NDVI[i] = veg80s.reduceRegion({
        reducer:ee.Reducer.mean(),
        bestEffort:true,
      }).get('nd'); // Vegtation Index and Counts

var   mask_bld80s = cls80s.eq(1),
      bld80s = img80s.normalizedDifference(['B4', 'B5']).updateMask(mask_bld80s);
      BLDAREA[i] = bld80s.reduceRegion({
        reducer:ee.Reducer.count(),
        bestEffort:true,
      }).get('nd'); // Building Counts

//Map.addLayer(cls80s,{min:0,max:1});
// End for
}

// Compute 2018 Alone
var img = ee.Image('LANDSAT/LC08/C01/T1_SR/LC08_117045_20180921').clip(yakouSea),
    training = img.select(bands8).sampleRegions({
          collection:trainroi,
          properties:['region'],
          scale:30
      }),
      classifier = ee.Classifier.randomForest().train({
          features:training,
          classProperty:'region',
          inputProperties:bands8
      }),
      cls = img.select(bands8).classify(classifier); // Classification Above

var   mask_veg = cls.eq(0),
      veg = img.normalizedDifference(['B5', 'B4']).updateMask(mask_veg);
      NDVI[3] = veg.reduceRegion({
        reducer:ee.Reducer.mean(),
        bestEffort:true,
      }).get('nd'); // Vegtation Index and Counts

var   mask_bld = cls.eq(1),
      bld = img.normalizedDifference(['B5', 'B6']).updateMask(mask_bld);
      BLDAREA[3] = bld.reduceRegion({
        reducer:ee.Reducer.count(),
        bestEffort:true,
      }).get('nd'); // Building Counts

// Add Layers
//Map.addLayer(cls,{min:0,max:1});

// Print Sattistics
print(NDVI,BLDAREA);