题目总览

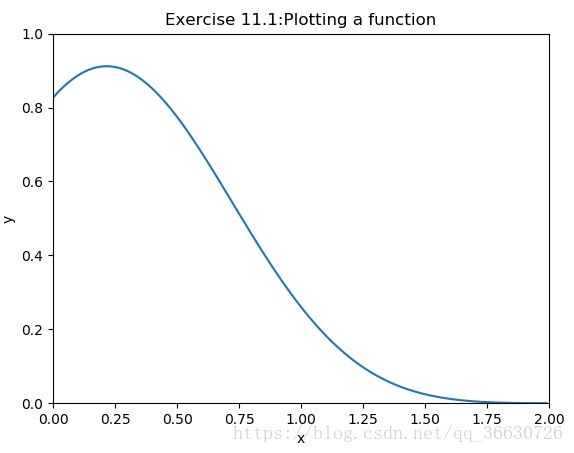
1、Plotting a function
代码
import numpy as np
import matplotlib.pyplot as plt
X = np.arange(0,2,0.01)
Y = np.sin(X-2)*np.sin(X-2)*np.exp(-X*X)
fig, ax=plt.subplots()
ax.plot(X,Y)
ax.set_xlabel('x')
ax.set_ylabel('y')
ax.set_xlim((0,2))
ax.set_ylim((0,1))
ax.set_title('Exercise 11.1:Plotting a function')
plt.show()
运行结果

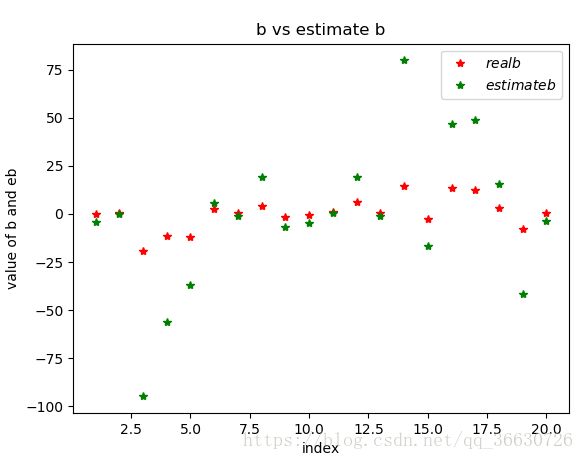
2、Data
代码
import matplotlib.pyplot as plt
import numpy as np
def LinearLeastSquare(X,Y):
N = len(X)
sumx = sum(X)
sumy = sum(Y)
sumx2 = sum(X**2)
sumxy = sum(X*Y)
MA = [[sumx2,sumx],[sumx,N]]
VB = [sumxy,sumx]
eb,c = np.linalg.solve(MA,VB)
return eb
def main():
X = []
for i in range(0,20):
X_item = np.random.random(10)
X.append(X_item)
X = np.array(X)
X = X*10
b = np.random.normal(loc=2.,scale=8.,size=20)
z = np.random.normal(loc=0.,scale=1.,size=10)
eb = []
for i in range(0,20):
X_item = X[i]
bi = b[i]
Y = X_item * bi + z
eb_item = LinearLeastSquare(X_item,Y)
eb.append(eb_item)
Index = list(range(1,21))
plt.plot(Index,b,'r*',label='$real b$')
plt.plot(Index,eb,'g*',label='$estimate b$')
plt.xlabel('index')
plt.ylabel('value of b and eb')
plt.title('b vs estimate b')
plt.legend()
plt.show()
if __name__ == '__main__':
main()
运行结果

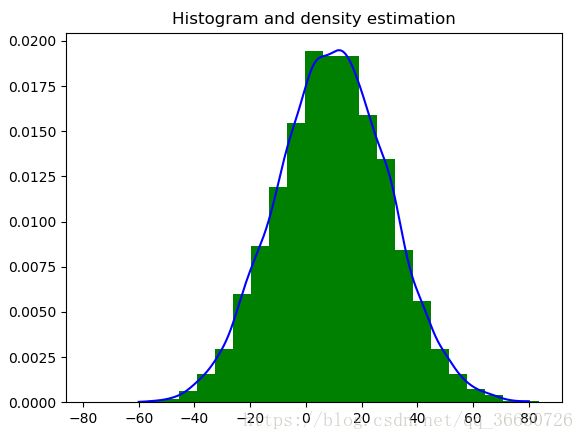
3、Histogram and density estimation
代码(使用stats)
import numpy as np
import matplotlib.pyplot as plt
from scipy import stats
import matplotlib

z=np.random.normal(loc=10,scale=20,size=10000)
figure,ax=plt.subplots()
ax.hist(z, bins=25,color='g',density=True)
kernel=stats.gaussian_kde(z)
x=np.linspace(-60,80,3000)
y=kernel.pdf(x)
ax.plot(x,y,'b-')
ax.set_title('Exercise 11.3:Histogram and density estimation')
plt.show()
运行结果(使用stats)

代码(使用displot)
import seaborn
import matplotlib.pyplot as plt
import numpy as np

data = np.random.normal(loc=10,scale=20,size=10000)
seaborn.distplot(data,bins=25,hist=True)
plt.show()
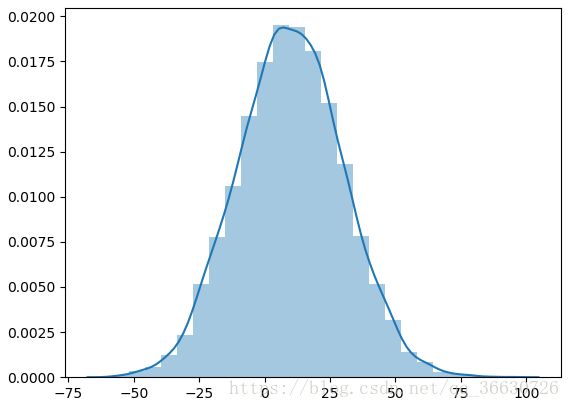
运行结果(使用displot)


