通过R语言实现基金Brinson归因分析
最近学习了Brinson模型,发现网上关于这方面的资料挺少,所以结合个人学习过程,总结一下如何通过R实现Brinson归因分析。
关于Brinson分析的原理不再说明,网上有一些资料,推荐大家看这个:
http://zhiqiang.org/blog/finance/school/performance-attribution-brison-model.html
事实上,R里有一个pa包可以快速实现Brinson分析,也能出一些比较美观的图,但是知道的人并不太多,我也是查了很久才发现这个包,下面就说明一下这个包具体怎么使用。
文章包括以下几个部分:
- 对各函数用法结合例子进行说明
- 对部分源码进行分析
通过pa包可以快速实单期、多期Brinson分析,用到的函数包括brison,plot,summary等
首先在R里安装并载入pa包,这个部分很简单。
install.package('pa')
library(pa)
下面对函数用法进行说明,pa包的说明文档也可以看一看,写的很详细。
函数:brinson
brinson(x, date.var = "date", cat.var = "sector", bench.weight ="benchmark",portfolio.weight = "portfolio", ret.var = "return")
brinson函数可以进行单期brinson分析,也可以进行多期brinson分析。
输入参数:
- x:用来进行Brinson分析的变量,必须为dataframe
- date.var:x中表示时间的列,若值相同,进行单期brison分析,若值不同,进行多期brison分析
- cat.var:x中表示行业类别的变量
- bench.weight:x中表示基准组合股票权重的变量
- protfolio.weight:x中表示实际组合股票权重的变量
- ret.var:x中表示实际组合收益率的变量
单期Brinson分析
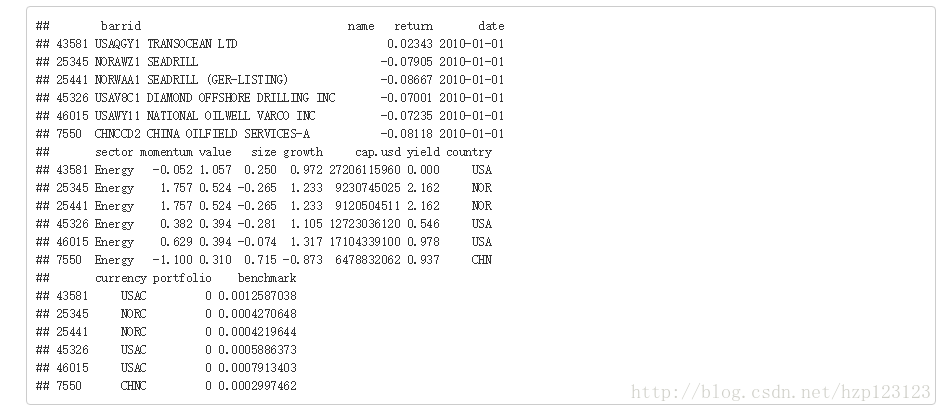
通过数据jan可进行单期Brinson分析,jan每一行表示一只股票,
数据各列依次表示:股票代码、股票名称、股票收益率、日期、股票所属行业、momentum因子、size因子、
growth因子、cap.usd因子、yield因子、counrty因子、currency因子、实际行业权重、基准行业权重,中间的那些因子不用管,我们用不到,他跟另一个高大上的模型Barra有关,下次有机会我们可以聊聊这个,主要看股票所属行业,实际行业权重和收益率,以及基准行业收益率,(这些名词请参考上面链接的文档)
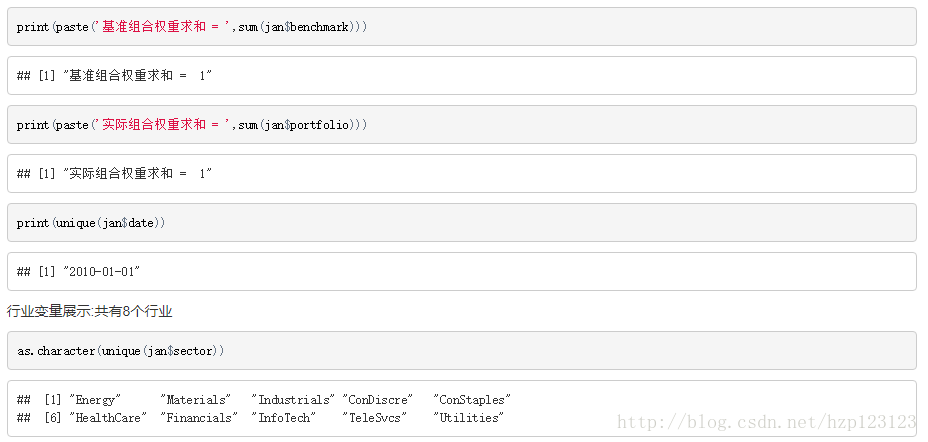
首先可以简单了解一下数据,比如权重和是否为1,日期是否只有一个,都有哪些行业
接下来直接通过brinson函数进行分析,这部分就很简单了,直接调用函数,输入需要的变量就可以了
p1 <- brinson(x = jan, date.var = "date", cat.var = "sector", bench.weight = "benchmark",
    portfolio.weight = "portfolio", ret.var = "return")
summary(p1)
输出很长
    Period:                              2010-01-01
    Methodology:                         Brinson
    Securities in the portfolio:         200
    Securities in the benchmark:         1000

    Exposures
                Portfolio Benchmark     Diff
    Energy          0.085    0.2782 -0.19319
    Materials       0.070    0.0277  0.04230
    Industrials     0.045    0.0330  0.01201
    ConDiscre       0.050    0.0188  0.03124
    ConStaples      0.030    0.0148  0.01518
    HealthCare      0.015    0.0608 -0.04576
    Financials      0.370    0.2979  0.07215
    InfoTech        0.005    0.0129 -0.00787
    TeleSvcs        0.300    0.1921  0.10792
    Utilities       0.030    0.0640 -0.03399

    Returns
    $`Attribution by category in bps`
                Allocation Selection Interaction
    Energy         110.934    -37.52      26.059
    Materials      -41.534      0.48       0.734
    Industrials      0.361      1.30       0.473
    ConDiscre      -28.688     -4.23      -7.044
    ConStaples       5.467     -3.59      -3.673
    HealthCare      -6.692     -4.07       3.063
    Financials     -43.998     70.13      16.988
    InfoTech        -3.255     -5.32       3.255
    TeleSvcs       -23.106     41.55      23.348
    Utilities       16.544     83.03     -44.108
    Total          -13.966    141.77      19.095

    $Aggregate
                       2010-01-01
    Allocation Effect    -0.00140
    Selection Effect      0.01418
    Interaction Effect    0.00191
    Active Return         0.01469
结果说明
- 第一块是总的说明,没什么用处
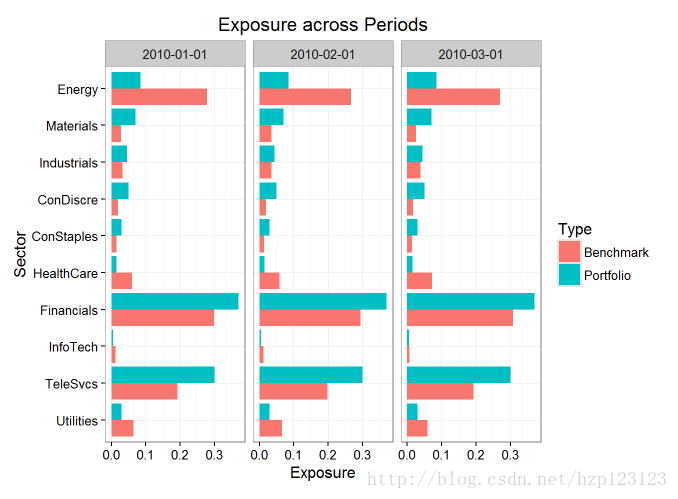
- 第二块Exposures展示的是各个行业的基准行业权重(Benchmark)和实际行业权重(Portfolio列)及他们的差值,
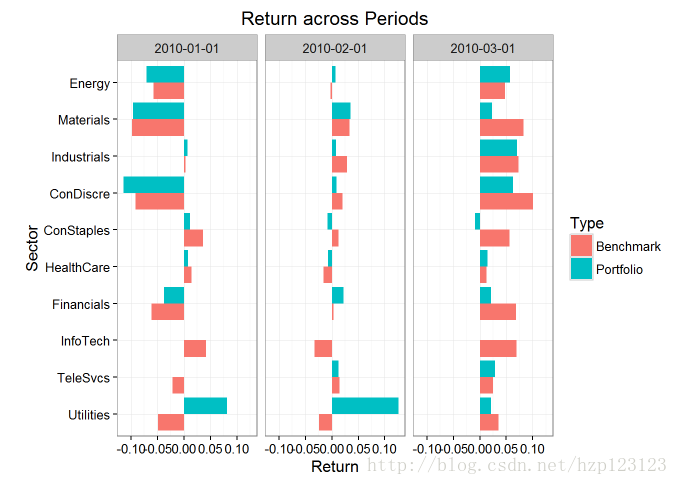
- 第三块Returns部分展示的是各个行业的资产配置效益(Allocation)、个股选择效益(Selection )、交叉效益(Interaction)
- 第四块表示总的资产配置效益(Allocation Effect)、个股选择效益(Selection Effect)、交叉效益(Interaction Effect)总超额效益(Active Return)
图表分析
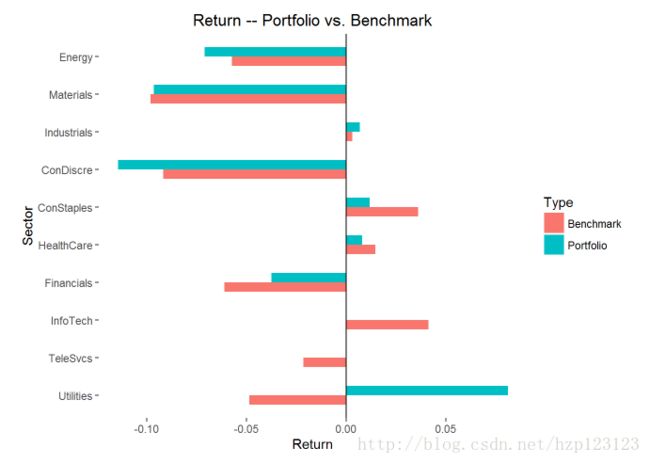
各行业收益率比较
plot(p1,type=’return’)
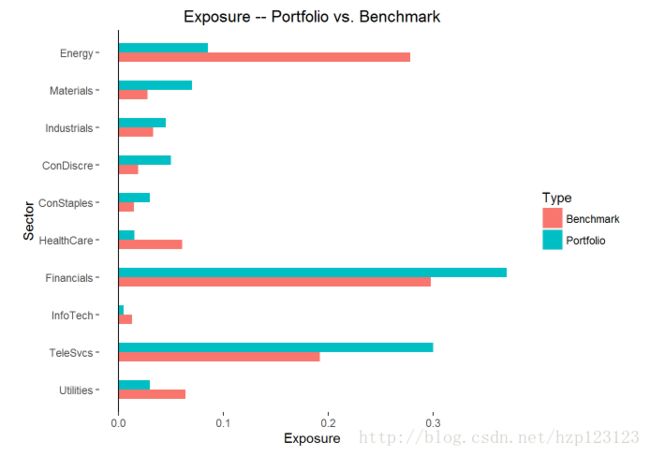
各行业权重比较
plot(p1,type=’exposure’)
综上就是单期Brinson分析的全过程,多期Brinson分析过程和结果都类似,直接上代码和图:
data("quarter")
p2 <- brinson(x = quarter, date.var = "date", cat.var = "sector",
bench.weight = "benchmark", portfolio.weight = "portfolio", ret.var =
"return")
summary(p2)
输出
Period starts:                       2010-01-01
Period ends:                         2010-03-01
Methodology:                         Brinson
Avg securities in the portfolio:     200
Avg securities in the benchmark:     1000

Exposures
$Portfolio
            2010-01-01 2010-02-01 2010-03-01
Energy           0.085      0.085      0.085
Materials        0.070      0.070      0.070
Industrials      0.045      0.045      0.045
ConDiscre        0.050      0.050      0.050
ConStaples       0.030      0.030      0.030
HealthCare       0.015      0.015      0.015
Financials       0.370      0.370      0.370
InfoTech         0.005      0.005      0.005
TeleSvcs         0.300      0.300      0.300
Utilities        0.030      0.030      0.030

$Benchmark
            2010-01-01 2010-02-01 2010-03-01
Energy          0.2782     0.2667    0.26985
Materials       0.0277     0.0354    0.02493
Industrials     0.0330     0.0357    0.03809
ConDiscre       0.0188     0.0196    0.01676
ConStaples      0.0148     0.0137    0.01381
HealthCare      0.0608     0.0590    0.07144
Financials      0.2979     0.2943    0.30752
InfoTech        0.0129     0.0119    0.00616
TeleSvcs        0.1921     0.1983    0.19225
Utilities       0.0640     0.0656    0.05919

$Diff
            2010-01-01 2010-02-01 2010-03-01
Energy        -0.19319    -0.1817   -0.18485
Materials      0.04230     0.0346    0.04507
Industrials    0.01201     0.0093    0.00691
ConDiscre      0.03124     0.0304    0.03324
ConStaples     0.01518     0.0163    0.01619
HealthCare    -0.04576    -0.0440   -0.05644
Financials     0.07215     0.0757    0.06248
InfoTech      -0.00787    -0.0069   -0.00116
TeleSvcs       0.10792     0.1017    0.10775
Utilities     -0.03399    -0.0356   -0.02919


Returns
$Raw
              2010-01-01 2010-02-01 2010-03-01
Allocation       -0.0014     0.0062     0.0047
Selection         0.0142     0.0173    -0.0154
Interaction       0.0019    -0.0072    -0.0089
Active Return     0.0147     0.0163    -0.0196

$Aggregate
              2010-01-01, 2010-03-01
Allocation                    0.0092
Selection                     0.0173
Interaction                  -0.0139
Active Return                 0.0127
各行业权重比较
plot(p2,type=’exposure’)
各行业收益比较
plot(p2,type=’return’)
源码分析
为了确认这个包中的代码是正确的,我们也对部分函数的源码进行了分析
实际调用brinson后,只会计算出q1,q2,q3,q4,也就是基准权重、实际权重、基准收益、实际收益组合后的四种收益(具体见文章开头提到的材料),之后调用summary时,summary内部会调用一个return函数,通过return函数可以算出资产配置效益、个股选择效益、交叉效益、总超额效益,然后再调用plot函数可以作图,因此我们对brinson、return 这两个关键函数进行源码注释,具体如下:
brinson
代码来源:R Consloe中输入brinson
function(x, date.var = "date", cat.var = "sector", bench.weight = "benchmark",
    portfolio.weight = "portfolio", ret.var = "return") {
    # ------------ 对输入数据的格式进行判断,若不符合要求,返回-----------
    stopifnot(is.data.frame(x))
    stopifnot(length(date.var) == 1)
    stopifnot(length(cat.var) == 1)
    stopifnot(length(bench.weight) == 1)
    stopifnot(length(portfolio.weight) == 1)
    stopifnot(length(ret.var) == 1)

    # 取出所有不重复的日期值
    dates <- unique(x[[date.var]])

# --------------------Brinson model ----------------------
# 条件语句,若所有不重复的日期值只有一个,进行单期Brinson分析,若超过1,进行多期Brinson分析
if (length(dates) > 1) {
    # -------------- 多期Brinson分析------------------------

    # 定义函数.fun:给定i,提取所有日期为i的数据,进行单期Brinson分析
    .fun <- function(i) {
        brinson(x[x[[date.var]] %in% i, ], date.var, cat.var, bench.weight,
            portfolio.weight, ret.var)
    }
    # 通过lapply函数批量操作:对所有不同日期都执行.fun函数,得到结果命名为multiples(为一个brinson对象)
    multiples <- lapply(dates, .fun)
    # 生成一个brinsonMulti对象,命名为portfolio,对属性日期,行业类别,基准组合行业权重数据在初始数据中的名称、实际组合行业权重数据在初始数据中的名称、实际组合行业收益率进行赋值,属性universe=multiples
    # (顺序对应)
    portfolio.multi <- new("brinsonMulti", date.var = as.character(dates),
        cat.var = cat.var, bench.weight = bench.weight, portfolio.weight = portfolio.weight,
        ret.var = ret.var, universe = multiples)

    # 初始化实际组合行业权重为空,然后通过循环从multiples中提实际组合行业权重值填入
    weight.port.mat <- NULL
    for (j in 1:length(dates)) {
        weight.port.mat <- cbind(weight.port.mat, multiples[[j]]@weight.port)
    }
    colnames(weight.port.mat) <- as.character(dates)
    # 初始化基准组合行业权重为空,然后通过循环从multiples中提取基准组合行业权重值填入
    weight.bench.mat <- NULL
    for (j in 1:length(dates)) {
        weight.bench.mat <- cbind(weight.bench.mat, multiples[[j]]@weight.bench)
    }
    colnames(weight.bench.mat) <- as.character(dates)
    # 初化实际组合行业收益率为空,然后通过循环从multiples中提取实际组合行业收益率值填入
    ret.port.mat <- NULL
    for (j in 1:length(dates)) {
        ret.port.mat <- cbind(ret.port.mat, multiples[[j]]@ret.port)
    }
    colnames(ret.port.mat) <- as.character(dates)
    # 初化基准组合收益率为空,然后通过循环从multiples中提取基准组合收益率值填入
    ret.bench.mat <- NULL
    for (j in 1:length(dates)) {
        ret.bench.mat <- cbind(ret.bench.mat, multiples[[j]]@ret.bench)
    }
    colnames(ret.bench.mat) <- as.character(dates)

    # 将上述得到的结果分别对应赋给portfolio中表示实际组合行业收益率、基准组合行业收益率、实际组合行业权重、基准组合行业权重的属性
    [email protected] <- ret.port.mat
    [email protected] <- ret.bench.mat
    [email protected] <- weight.port.mat
    [email protected] <- weight.bench.mat

    # 初始化矩阵brison.mat
    brinson.mat <- matrix(NA, nrow = 4, ncol = length(dates))
    # q4:实际行业收益率乘以实际行业权重
    brinson.mat[1, ] <- sapply(1:length(dates), function(i) {
        ret.port.mat[, i] %*% weight.port.mat[, i]
    })
    # q3:实际行业收益率乘以基准行业权重
    brinson.mat[2, ] <- sapply(1:length(dates), function(i) {
        ret.port.mat[, i] %*% weight.bench.mat[, i]
    })
    # q4:基准行业收益率乘以实际行业权重
    brinson.mat[3, ] <- sapply(1:length(dates), function(i) {
        ret.bench.mat[, i] %*% weight.port.mat[, i]
    })
    # q4:基准行业收益率乘以基准行业权重
    brinson.mat[4, ] <- sapply(1:length(dates), function(i) {
        ret.bench.mat[, i] %*% weight.bench.mat[, i]
    })
    colnames(brinson.mat) <- as.character(dates)
    rownames(brinson.mat) <- c("q4", "q3", "q2", "q1")
    # 将brinson.mat赋给portfolio.multi的对应属性,返回portfolio.multi
    [email protected] <- brinson.mat
    return(portfolio.multi)
} else {
    # ----------------- 单期Brinson分析 -----------------------

    # 与多期Brinson分析类似
    portfolio <- new("brinson", date.var = date.var, cat.var = cat.var,
        bench.weight = bench.weight, portfolio.weight = portfolio.weight,
        ret.var = ret.var, universe = x)
    weight.port <- tapply(x[[portfolio.weight]], x[[cat.var]], sum)
    weight.bench <- tapply(x[[bench.weight]], x[[cat.var]], sum)
    ret.bench <- .cat.ret(x = x, cat.var = cat.var, ret.var = ret.var, var = bench.weight)
    ret.port <- .cat.ret(x = x, cat.var = cat.var, ret.var = ret.var, var = portfolio.weight)
    ret.bench <- ret.bench/weight.bench
    ret.port <- ret.port/weight.port
    ret.bench[ret.bench == "NaN"] <- 0
    ret.port[ret.port == "NaN"] <- 0
    [email protected] <- weight.port
    [email protected] <- weight.bench
    [email protected] <- ret.port
    [email protected] <- ret.bench
    q4 <- ret.port %*% weight.port
    q3 <- ret.port %*% weight.bench
    q2 <- ret.bench %*% weight.port
    q1 <- ret.bench %*% weight.bench
    portfolio@q4 <- q4[1, 1]
    portfolio@q3 <- q3[1, 1]
    portfolio@q2 <- q2[1, 1]
    portfolio@q1 <- q1[1, 1]
    return(portfolio)
}
}
return
代码来源:https://github.com/yl2/pa/blob/master/pkg/R/returns.R
setMethod(“returns”,
signature(object = “brinson”),
function(object,
…){## round to certain digits options(digits = 3) ## returns by category portret <- [email protected] benchret <- [email protected] portwt <- [email protected] benchwt <- [email protected] # 计算各行业的资产配置收益率、个股选择收益率、交叉收益率 cat.allocation <- (portwt - benchwt) * benchret cat.selection <- (portret - benchret) * benchwt cat.interaction <- (portret - benchret) * (portwt - benchwt) cat.ret <- cbind(cat.allocation, cat.selection, cat.interaction) colnames(cat.ret) <- c("Allocation", "Selection", "Interaction") cat.ret <- rbind(cat.ret, apply(cat.ret, 2, sum)) rownames(cat.ret)[nrow(cat.ret)] <- "Total" ## overall brinson attribution # 计算总的资产配置收益率(Allocation)、个股选择收益率(Selection)、交叉收益率(Interaction)、总超额收益率(Active Return) q1 <- object@q1 q2 <- object@q2 q3 <- object@q3 q4 <- object@q4 asset.allocation <- q2 - q1 stock.selection <- q3 - q1 interaction <- q4 - q3 - q2 + q1 active.ret <- q4 - q1 ret.mat <- matrix(NA, nrow = 4, ncol = 1) ret.mat[1, 1] <- asset.allocation ret.mat[2, 1] <- stock.selection ret.mat[3, 1] <- interaction ret.mat[4, 1] <- active.ret colnames(ret.mat) <- as.character(unique(object@universe[[[email protected]]])) rownames(ret.mat) <- c("Allocation Effect", "Selection Effect", "Interaction Effect", "Active Return") ## organize output output.list <- list() output.list[[1]] <- cat.ret * 10000 output.list[[2]] <- ret.mat names(output.list) <- c("Attribution by category in bps", "Aggregate") return(output.list) } ) ## returns method for brinsonMulti class with three different types of ## compounding - arithmetic, geometric and linking coefficient ## approach. setMethod("returns", signature(object = "brinsonMulti"), function(object, type = "geometric", ...){ stopifnot(type %in% c("arithmetic", "linking", "geometric")) ## three types - default is geometric, the other two are ## arithmetic and linking active.return <- [email protected][1,] - [email protected][4,] allocation <- [email protected][3,] - [email protected][4,] selection <- [email protected][2,] - [email protected][4,] interaction <- active.return - allocation - selection ari.raw <- rbind(allocation, selection, interaction, active.return) rownames(ari.raw) <- c("Allocation", "Selection", "Interaction", "Active Return") if (type == "arithmetic"){ ari.agg <- .aggregate(object, ari.raw) ari.list <- .combine(ari.raw, ari.agg) return(ari.list) } if (type == "linking"){ port.ret.overtime <- apply([email protected] + 1, 1,prod)[1] bench.ret.overtime <- apply([email protected] + 1, 1, prod)[4] act.return <- port.ret.overtime - bench.ret.overtime T <- dim([email protected])[2] A.natural.scaling <- act.return / T / ((port.ret.overtime) ^ (1 / T) - (bench.ret.overtime) ^ (1 / T)) names(A.natural.scaling) <- NULL C <- (act.return - A.natural.scaling * sum([email protected][1,] - [email protected][4,])) / (sum(([email protected][1,] - [email protected][4,])^2)) alpha <- C * ([email protected][1,] - [email protected][4,]) B.linking <- A.natural.scaling + alpha linking.raw <- t(sapply(1:4, function(i){ari.raw[i,] * B.linking})) rownames(linking.raw) <- c("Allocation", "Selection", "Interaction", "Active Return") linking.agg <- .aggregate(object, linking.raw) linking.list <- .combine(linking.raw, linking.agg) return(linking.list) } if (type == "geometric"){ temp.mat <- apply([email protected] + 1, 1, prod) - 1 allocation <- temp.mat[3] - temp.mat[4] ## q2 - q1 selection <- temp.mat[2] - temp.mat[4] ## q3 - q1 ## q4 - q3 - q2 + q1 interaction <- temp.mat[1] - temp.mat[2] - temp.mat[3] + temp.mat[4] active.ret <- temp.mat[1] - temp.mat[4] ## q4 - q1 ret.mat <- matrix(NA, nrow = 4, ncol = 1) ret.mat[1, 1] <- allocation ret.mat[2, 1] <- selection ret.mat[3, 1] <- interaction ret.mat[4, 1] <- active.ret colnames(ret.mat) <- paste(c(min(unique(as.character([email protected]))), max(unique(as.character([email protected])))), collapse = ", ") rownames(ret.mat) <- c("Allocation", "Selection", "Interaction", "Active Return") geo.list <- .combine(ari.raw, ret.mat) return(geo.list) } } )
希望对学习brinson的人有所帮助,如果有错误,请指出,谢谢。
