ENGINPLOY Ep3 - Pyecharts Visualize Data
ENGINPLOY Ep3 - Pyecharts Visualize Data
Hello guys, I am William Lee, and this is Enginploy Episode Three. Today, I want to give you guys some things special. I used Pyecharts to visualize the data that we have collected in the previous episode which took me a couple of days to read documents and debug my scripts. The result, visualizing the data, is that I made a bunch of charts to find out the secret of the data. Now, let me introduce the charts one by one.
Positions’ Distribution in The Dimension of Company

There are a few companies open their positions in Q4. Only less than 30 companies are willing to open about 7 to 30 positions. Most of them, approximately 150 companies, open about 1 or 2 positions.
Positions’ Distribution in The Dimension of City
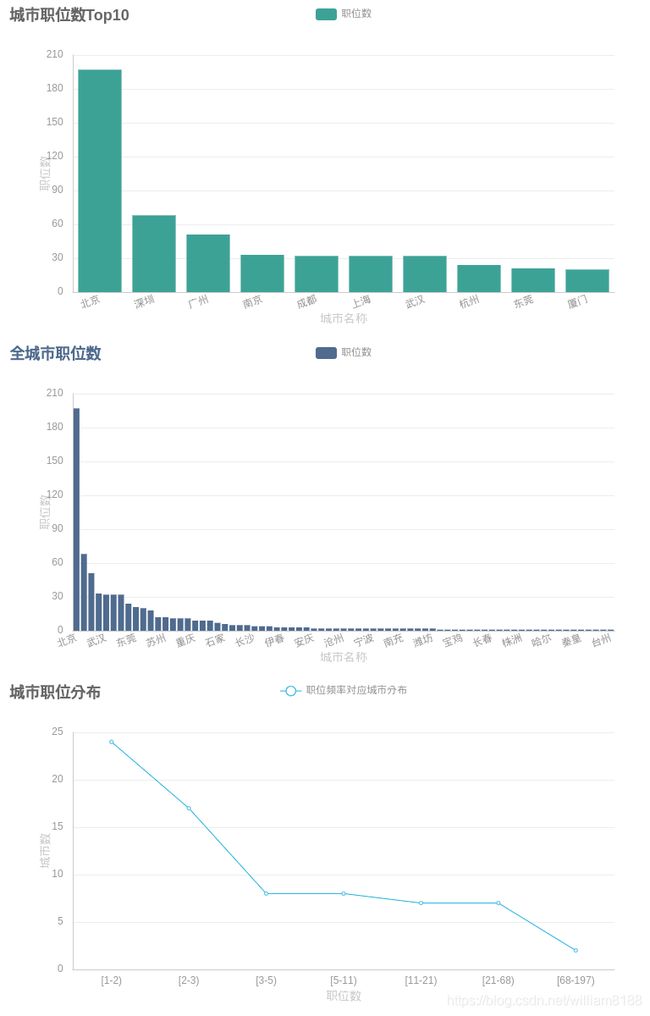
Many companies concentrate on Beijing which cause that Beijing provide more positions than any other cities.
Positions’ Distribution in The Dimension of Industry
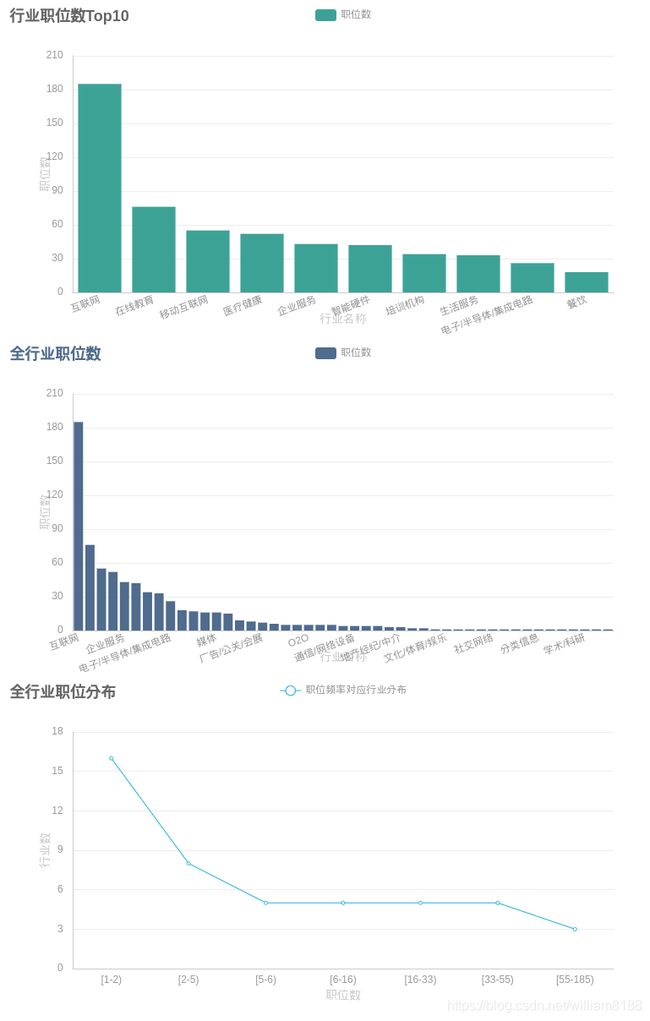
Here is a problem. The concept of Internet is more abstract than the others, such as Social Network, Mobile Internet, O2O, Enterprise Service, etc. Therefore, this chart cannot clearly describe the position’s distribution in the dimension of industry. In other words, I’m sorry guys, the data kick my ass : )
Positions’ Distribution in The Dimension of Education and Experience

Bachelar is always the most popular degrees. Junior positions occupy a huge percentage of total.
Positions’ Distribution in The Dimension of Salary
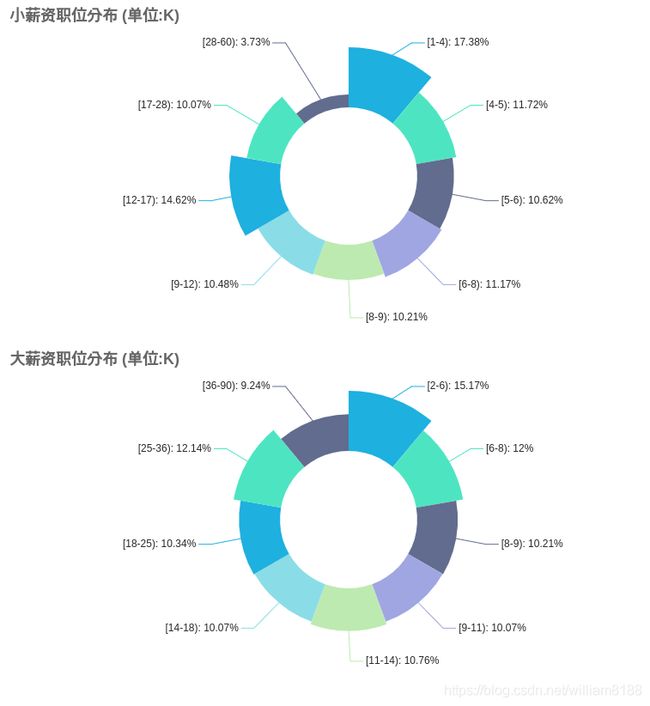
Because the salary information of position is a range, such as 8k-12k. So I define the 8k as micro-salary and the 12k as macro-salary. And then, I respectively make charts for them.
Salary Distribution in The Dimension of Position
I used jieba to cut the word of position name and I get the result below.
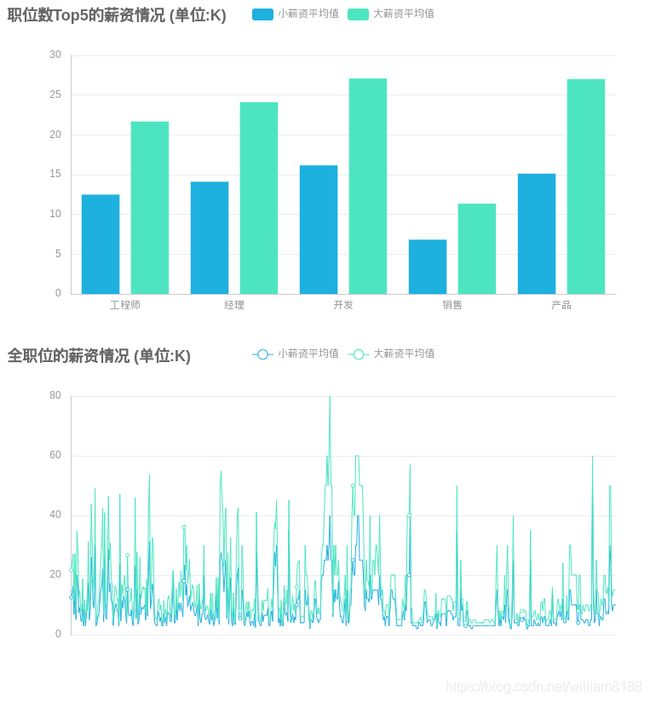
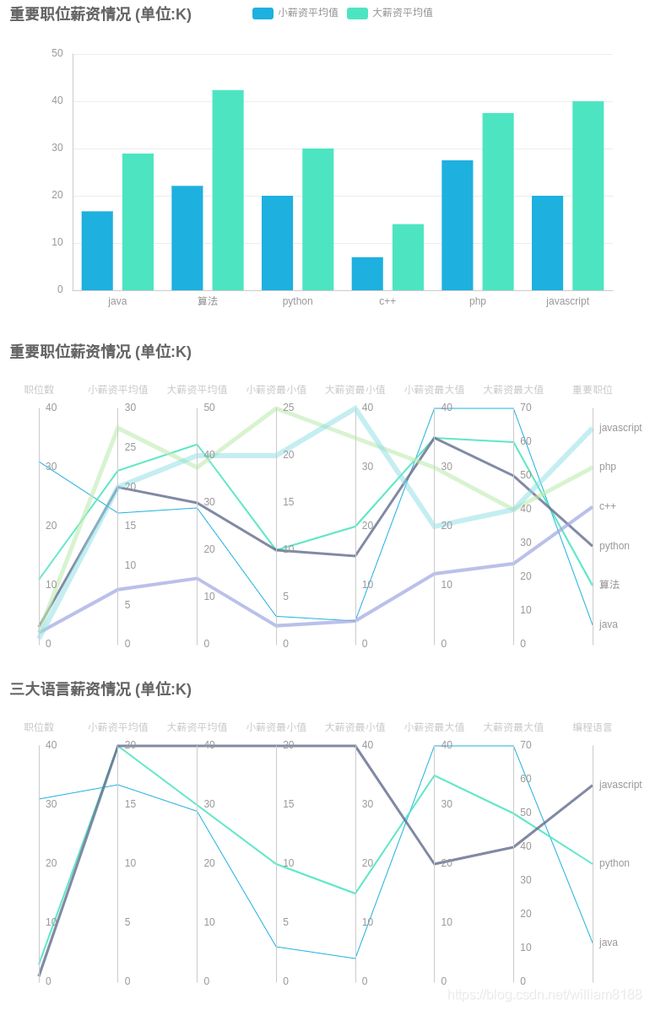
I get a few positions of javascript and python, so don’t be serious. Next times, I will collect more of those.
Word Count of Positions
Words cut by jieba

Trailer
In the next episode, I will try to build up a standard information of company, maybe I will use selenium to implement that mission. Thanks for reading, I will see you next time.
If you want to read previous episodes, please click the links below:
Enginploy Episode 2 - Find Some Jobs
Enginploy Episode 1 - Find Some Rich Companies
And Chinese version:
招聘工程学 第二集 - 有钱公司在招什么人
招聘工程学 第一集 - 寻觅有钱的公司
If you want to review my source code, please click here:
https://github.com/william8188/enginploy