python pyecharts数据可视化 玫瑰图、柱形图、饼图、环图
其实真正能让自己走远的,都是自律、积极和勤奋。
文章目录
- 一、柱形图
- 二、饼图
- 三、环图
- 四、玫瑰图
一、柱形图
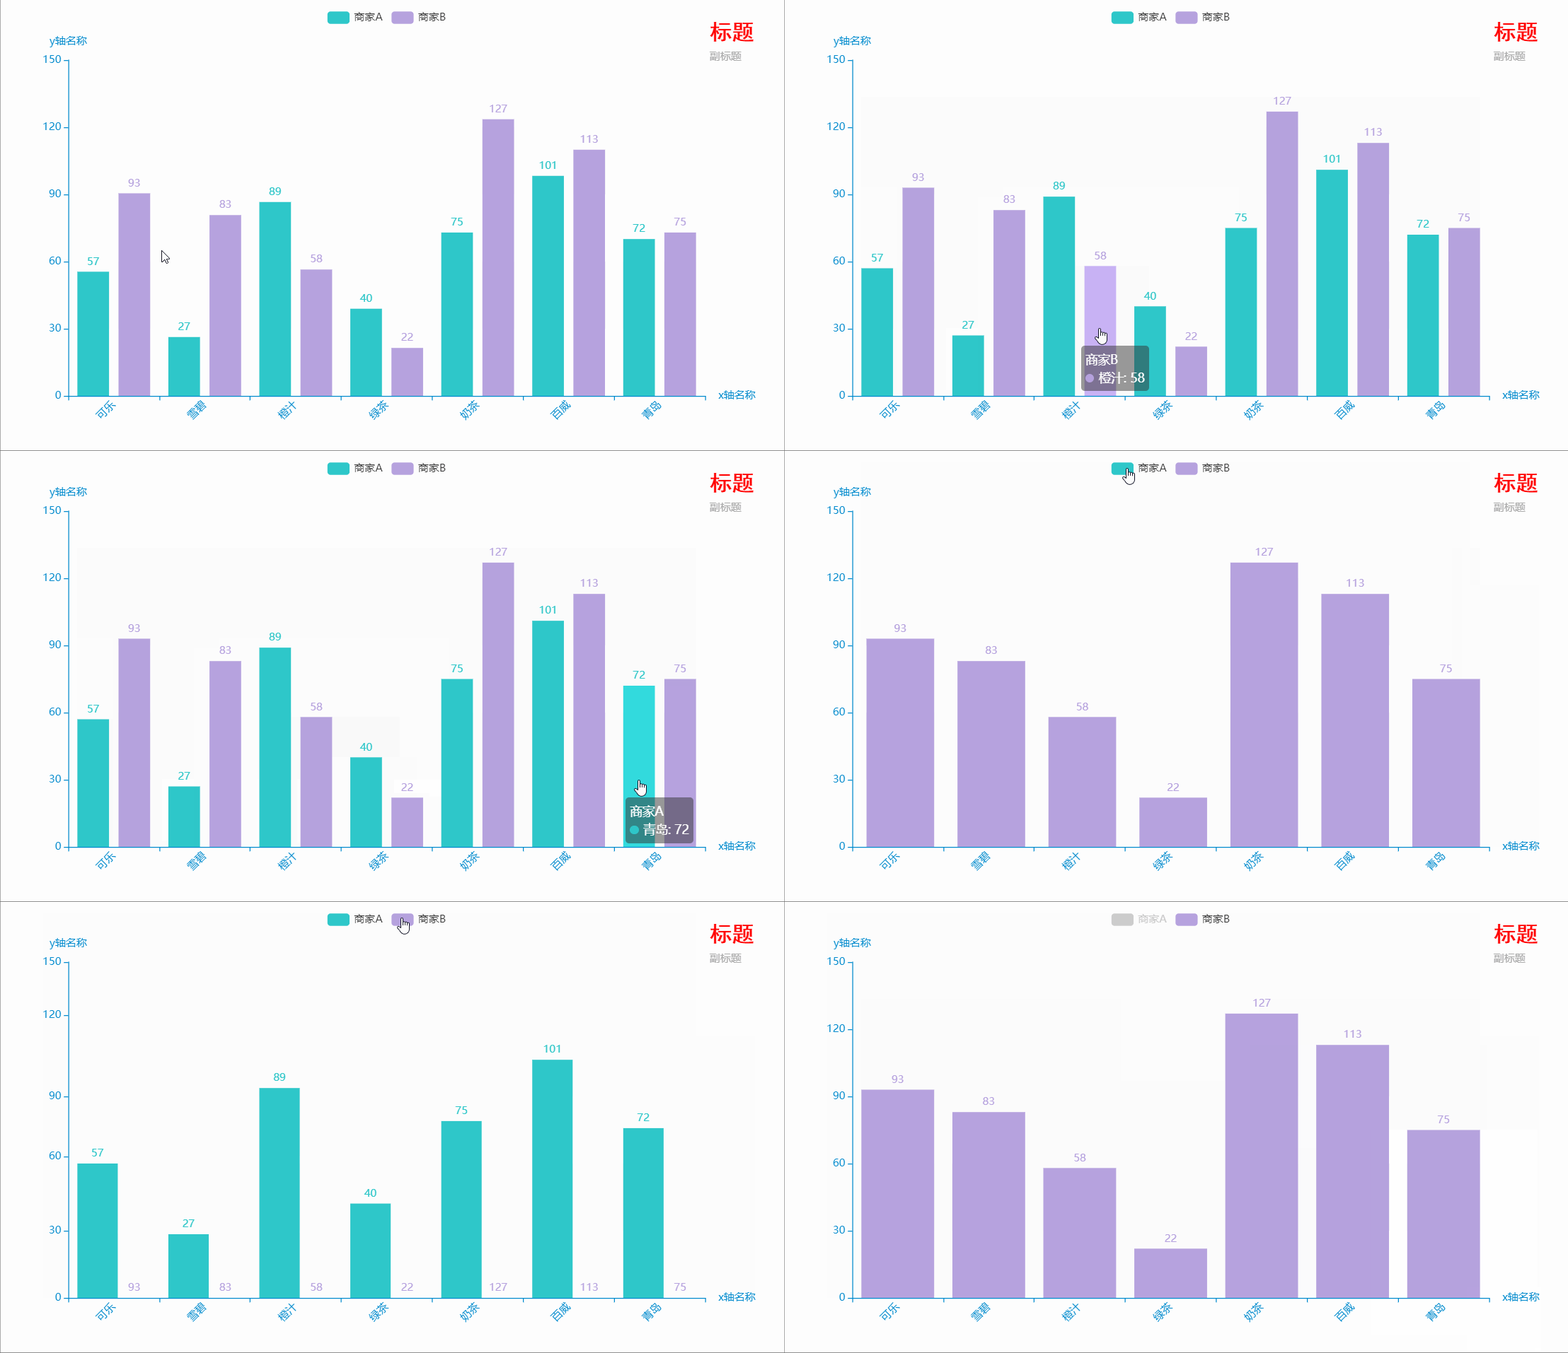
代码如下:
from pyecharts.charts import Bar
from pyecharts.faker import Faker
from pyecharts.globals import ThemeType, CurrentConfig
from pyecharts import options as opts


CurrentConfig.ONLINE_HOST = 'D:/python/pyecharts-assets-master/assets/'
# 链式调用
c = (
    Bar(
        init_opts=opts.InitOpts(           # 初始配置项
            theme=ThemeType.MACARONS,
            animation_opts=opts.AnimationOpts(
                animation_delay=1000, animation_easing="cubicOut"   # 初始动画延迟和缓动效果
            ))
        )
    .add_xaxis(xaxis_data=Faker.choose())      # x轴
    .add_yaxis(series_name="商家A", yaxis_data=Faker.values())       # y轴
    .add_yaxis(series_name="商家B", yaxis_data=Faker.values())       # y轴
    .set_global_opts(
        title_opts=opts.TitleOpts(title='标题', subtitle='副标题',   # 标题配置和调整位置
                                  title_textstyle_opts=opts.TextStyleOpts(
                                  font_family='SimHei', font_size=25, font_weight='bold', color='red',
                                  ), pos_left="90%", pos_top="10",
                                  ),
        xaxis_opts=opts.AxisOpts(name='x轴名称', axislabel_opts=opts.LabelOpts(rotate=45)),  # 设置x名称和Label rotate解决标签名字过长使用
        yaxis_opts=opts.AxisOpts(name='y轴名称'),

    )
    .render("bar_001.html")
)
运行效果如下:
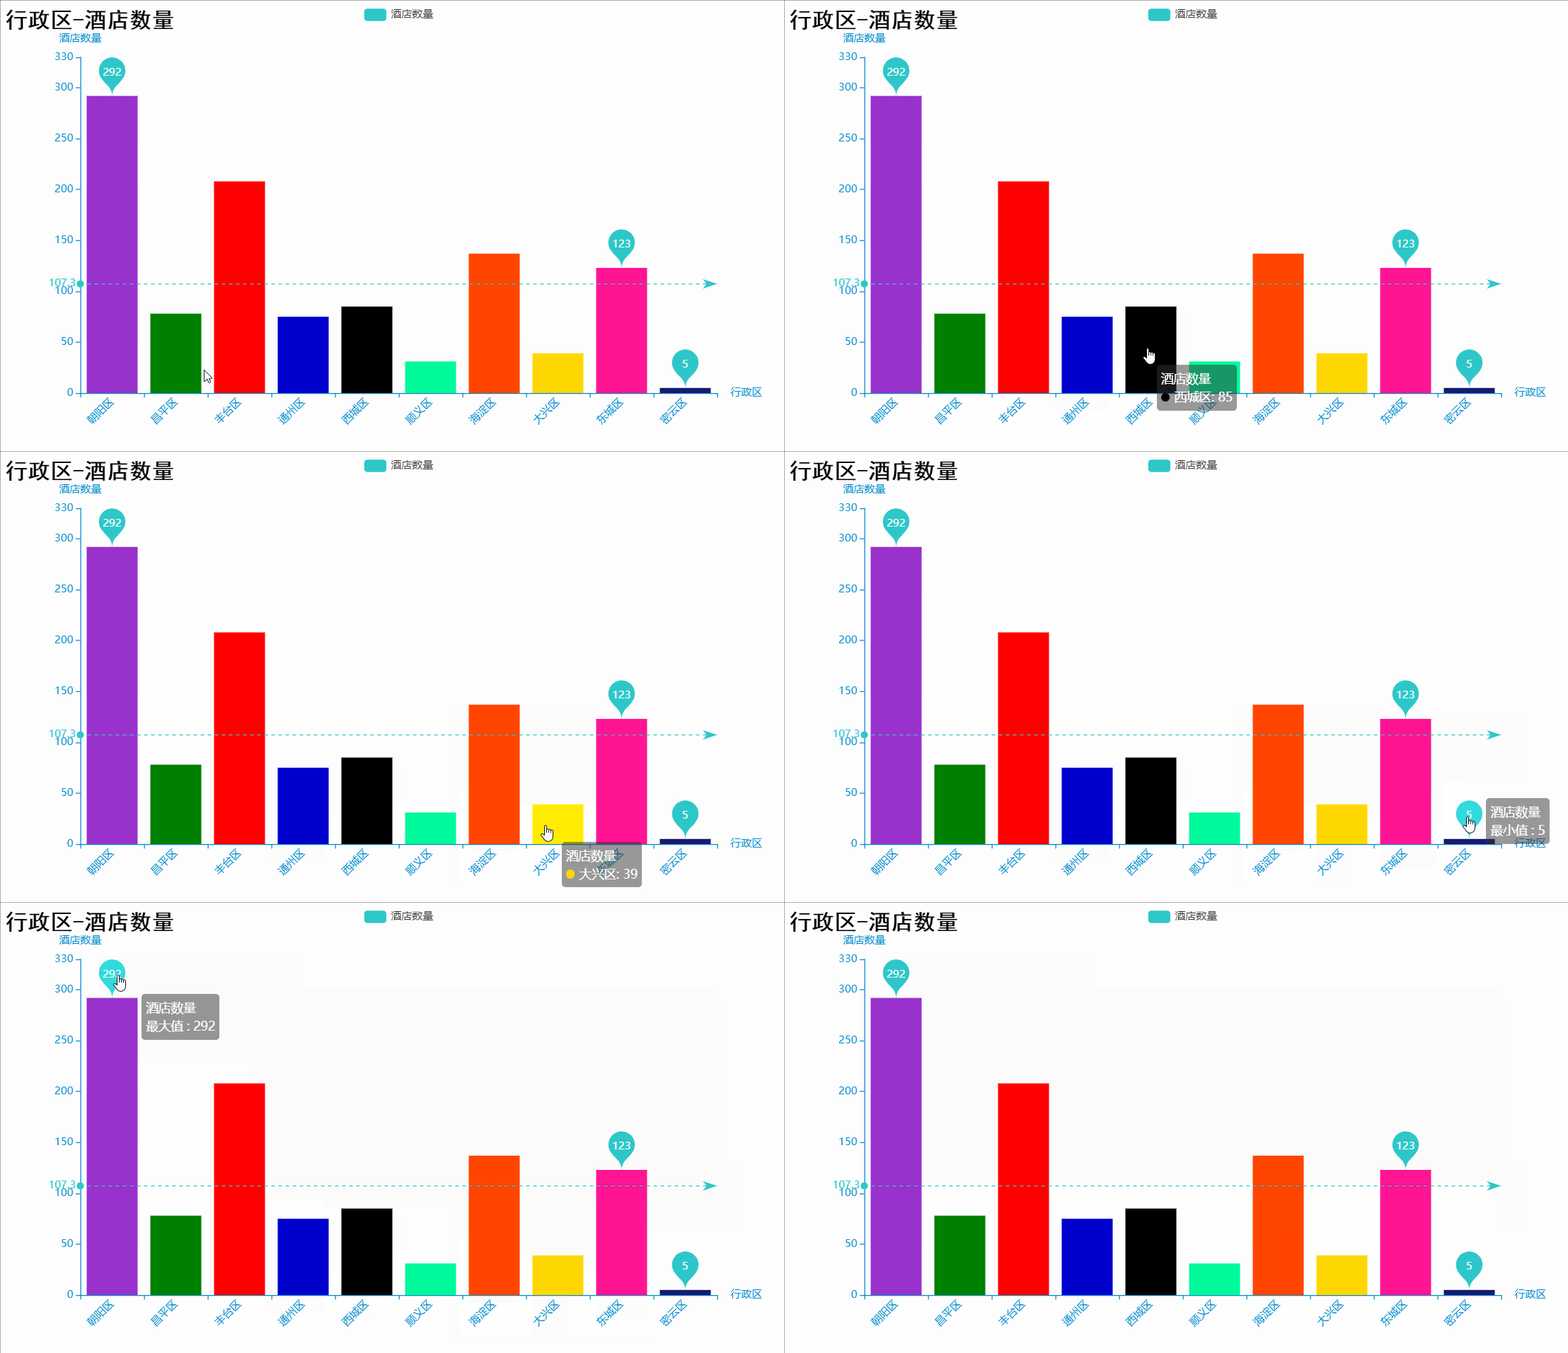
代码如下:
import pandas as pd
import collections
from pyecharts import options as opts
from pyecharts.charts import Bar
from pyecharts.globals import ThemeType, CurrentConfig
import random

CurrentConfig.ONLINE_HOST = 'D:/python/pyecharts-assets-master/assets/'

df = pd.read_excel("hotel.xlsx")
area = list(df['酒店地址'])
area_list = []
for i in area:
	_index = i.find("区")
	# 字符串切片得到行政区名
	i = i[:_index + 1]
	area_list.append(i)

area_count = collections.Counter(area_list)
area_dic = dict(area_count)

# 两个列表对应   行政区  对应的酒店数量
area = [x for x in list(area_dic.keys())][0:10]
nums = [y for y in list(area_dic.values())][:10]

# 定制风格
bar = Bar(init_opts=opts.InitOpts(theme=ThemeType.MACARONS))
colors = ['red', '#0000CD', '#000000', '#008000', '#FF1493', '#FFD700', '#FF4500', '#00FA9A', '#191970', '#9932CC']
random.shuffle(colors)
# 配置y轴数据  Baritem
y = []
for i in range(10):
	y.append(
		opts.BarItem(
			value=nums[i],
			itemstyle_opts=opts.ItemStyleOpts(color=colors[i])   # 设置每根柱子的颜色
		)
	)
bar.add_xaxis(xaxis_data=area)
bar.add_yaxis("酒店数量", yaxis_data=y)
bar.set_global_opts(xaxis_opts=opts.AxisOpts(
									name='行政区',
									axislabel_opts=opts.LabelOpts(rotate=45)
									),
					yaxis_opts=opts.AxisOpts(
									name='酒店数量', min_=0, max_=330,     # y轴刻度的最小值 最大值
					),
					title_opts=opts.TitleOpts(
						title="行政区-酒店数量",
						title_textstyle_opts=opts.TextStyleOpts(
							font_family="KaiTi", font_size=25, color="black"
						)
					))
# 标记最大值  最小值  平均值   标记平均线
bar.set_series_opts(label_opts=opts.LabelOpts(is_show=False),
					markpoint_opts=opts.MarkPointOpts(
					data=[
						opts.MarkPointItem(type_="max", name="最大值"),
						opts.MarkPointItem(type_="min", name="最小值"),
						opts.MarkPointItem(type_="average", name="平均值")]),
					markline_opts=opts.MarkLineOpts(
					data=[
						opts.MarkLineItem(type_="average", name="平均值")]))
bar.render("行政区酒店数量最多的Top10.html")
运行效果如下:
代码如下:
from pyecharts import options as opts
from pyecharts.charts import Bar
from pyecharts.faker import Faker
from pyecharts.globals import ThemeType, CurrentConfig

CurrentConfig.ONLINE_HOST = 'D:/python/pyecharts-assets-master/assets/'
c = (
    Bar(init_opts=opts.InitOpts(theme=ThemeType.DARK))
    .add_xaxis(xaxis_data=Faker.days_attrs)
    .add_yaxis("商家A", yaxis_data=Faker.days_values)
    .set_global_opts(
        title_opts=opts.TitleOpts(title="Bar-DataZoom(slider+inside)"),
        datazoom_opts=[opts.DataZoomOpts(), opts.DataZoomOpts(type_="inside")],
    )
    .render("bar_datazoom_both.html")
)
运行效果如下:
二、饼图
代码如下:
from pyecharts import options as opts
from pyecharts.charts import Pie
from pyecharts.faker import Faker
from pyecharts.globals import CurrentConfig

CurrentConfig.ONLINE_HOST = 'D:/python/pyecharts-assets-master/assets/'
c = (
    Pie()
    .add(
        "",
        [list(z) for z in zip(Faker.choose(), Faker.values())],
        # 饼图的中心(圆心)坐标,数组的第一项是横坐标,第二项是纵坐标
        # 默认设置成百分比,设置成百分比时第一项是相对于容器宽度,第二项是相对于容器高度
        center=["35%", "50%"],
    )
    .set_colors(["blue", "green", "yellow", "red", "pink", "orange", "purple"])   # 设置颜色
    .set_global_opts(
        title_opts=opts.TitleOpts(title="Pie-设置颜色-调整图例位置"),
        legend_opts=opts.LegendOpts(type_="scroll", pos_left="70%", orient="vertical"),  # 调整图例位置
    )
    .set_series_opts(label_opts=opts.LabelOpts(formatter="{b}: {c}"))
    .render("pie_set_color.html")
)
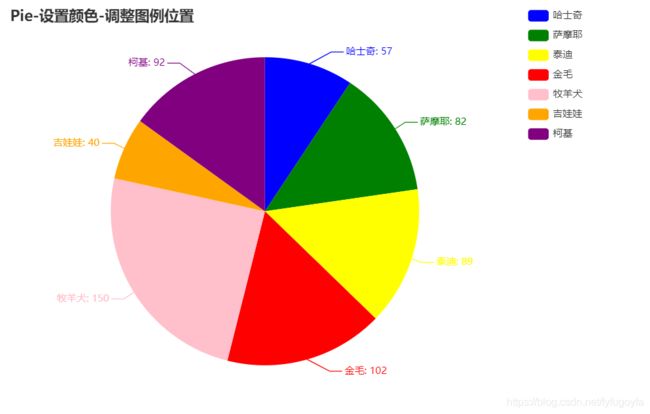
运行效果如下:
代码如下:
import pyecharts.options as opts
from pyecharts.charts import Pie
from pyecharts.globals import CurrentConfig

CurrentConfig.ONLINE_HOST = 'D:/python/pyecharts-assets-master/assets/'

x_data = ["深度学习", "数据分析", "Web开发", "爬虫", "图像处理"]
y_data = [688, 888, 560, 388, 480]
data_pair = [list(z) for z in zip(x_data, y_data)]
data_pair.sort(key=lambda x: x[1])

c = (
    # 宽  高  背景颜色
    Pie(init_opts=opts.InitOpts(width="1200px", height="800px", bg_color="#2c343c"))
    .add(
        series_name="学习方向",    # 系列名称
        data_pair=data_pair,      # 系列数据项,格式为 [(key1, value1), (key2, value2)]
        rosetype="radius",        # radius:扇区圆心角展现数据的百分比,半径展现数据的大小
        radius="55%",             # 饼图的半径
        center=["50%", "50%"],    # 饼图的中心(圆心)坐标,数组的第一项是横坐标,第二项是纵坐标
        label_opts=opts.LabelOpts(is_show=False, position="center"),   #  标签配置项
    )
    .set_global_opts(
        title_opts=opts.TitleOpts(
            title="Customized Pie",
            pos_left="center",
            pos_top="20",
            title_textstyle_opts=opts.TextStyleOpts(color="#fff"),
        ),
        legend_opts=opts.LegendOpts(is_show=False),
    )
    .set_series_opts(
        tooltip_opts=opts.TooltipOpts(
            trigger="item", formatter="{a}
{b}: {c} ({d}%)"  # 'item': 数据项图形触发,主要在散点图,饼图等无类目轴的图表中使用
         ),
        label_opts=opts.LabelOpts(color="rgba(255, 255, 255, 0.3)"),
    )
    .render("customized_pie.html")
)
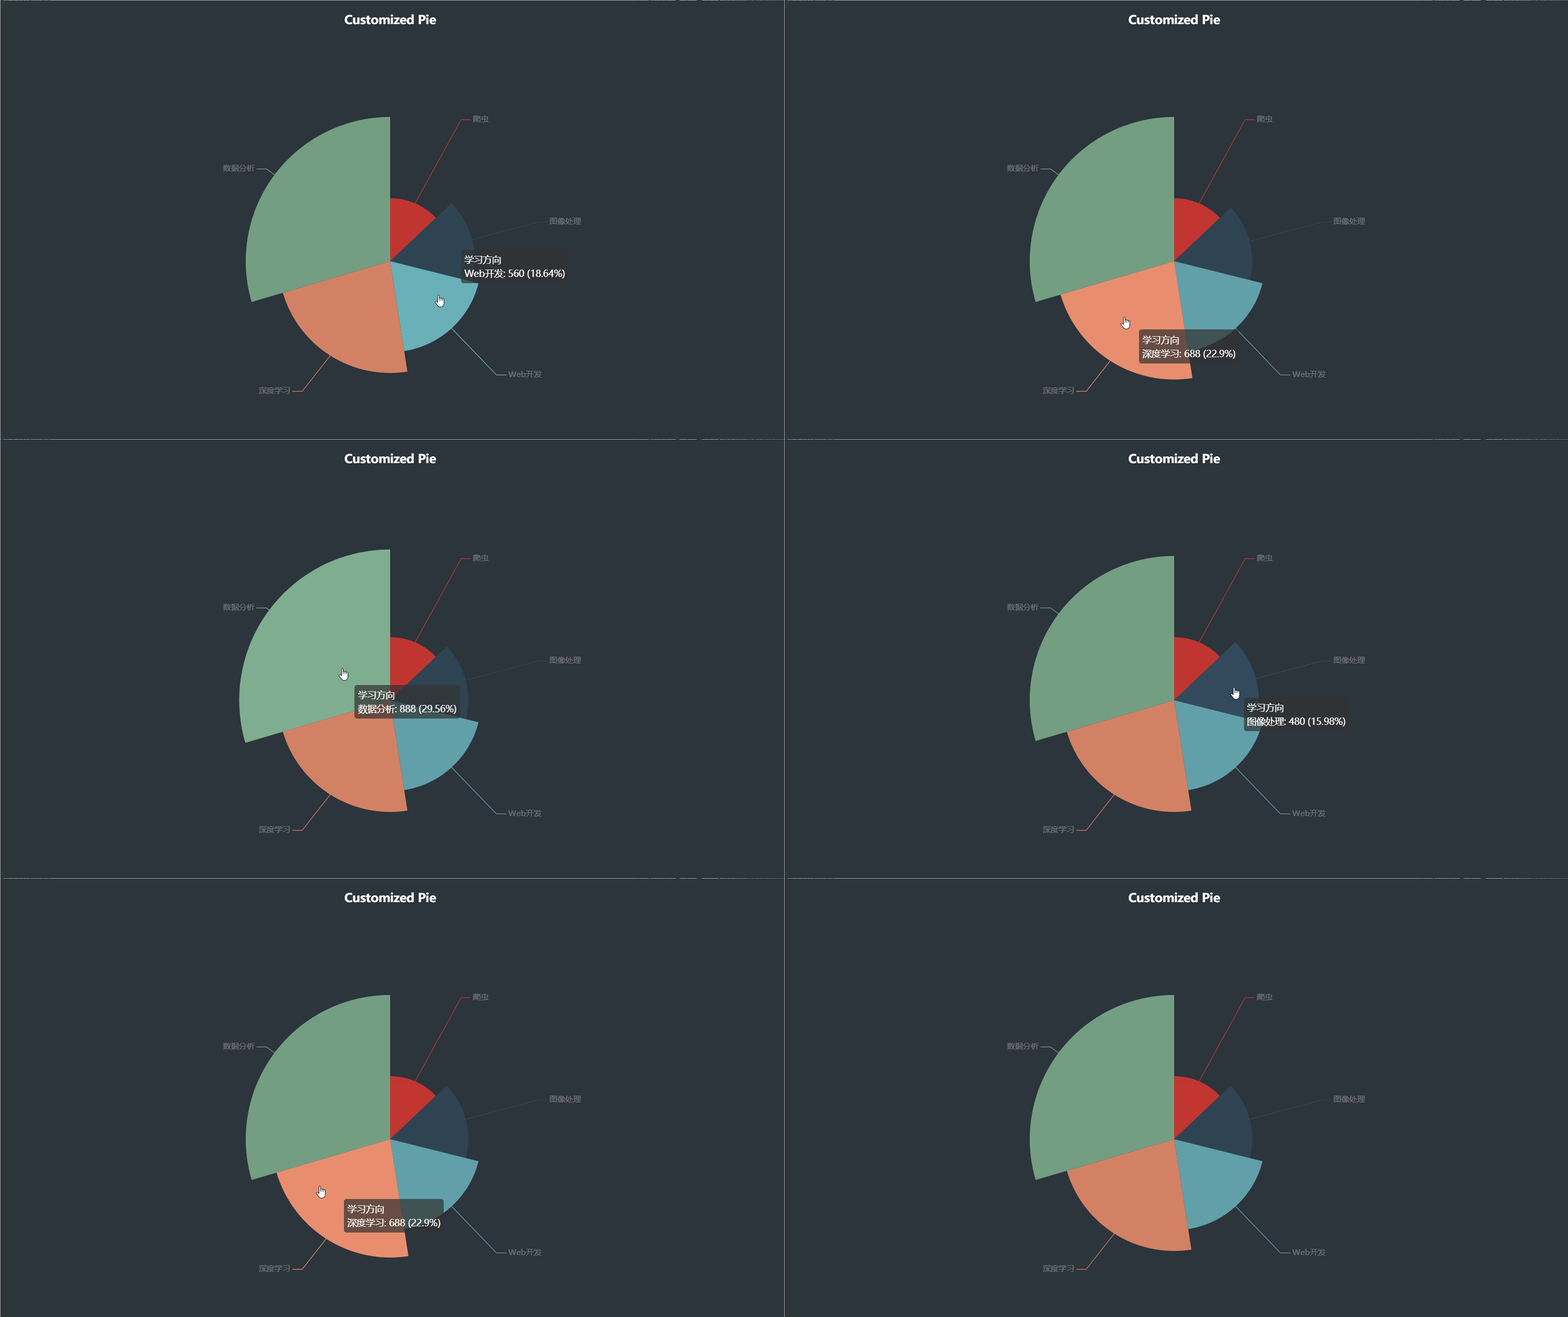
运行效果如下:
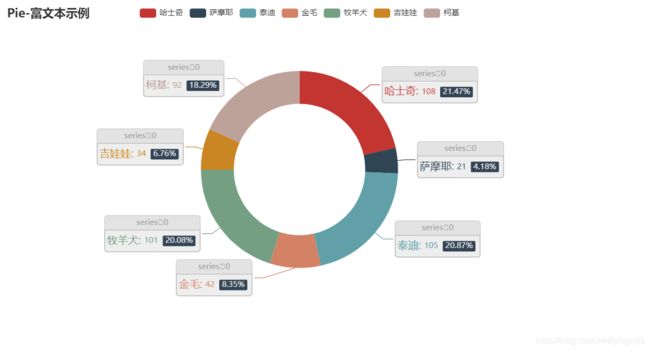
三、环图
代码如下:
from pyecharts import options as opts
from pyecharts.charts import Pie
from pyecharts.faker import Faker
from pyecharts.globals import CurrentConfig

CurrentConfig.ONLINE_HOST = 'D:/python/pyecharts-assets-master/assets/'
c = (
    Pie()
    .add(
        "",
        [list(z) for z in zip(Faker.choose(), Faker.values())],
        # 饼图的半径,数组的第一项是内半径,第二项是外半径
        # 默认设置成百分比,相对于容器高宽中较小的一项的一半
        radius=["40%", "60%"],
    )
    .set_colors(["blue", "green", "	#800000", "red", "#000000", "orange", "purple"])
    .set_global_opts(
        title_opts=opts.TitleOpts(title="Pie-Radius"),
        legend_opts=opts.LegendOpts(orient="vertical", pos_top="15%", pos_left="2%"),
    )
    .set_series_opts(label_opts=opts.LabelOpts(formatter="{b}: {c}"))
    .render("pie_radius.html")
)
代码如下:
from pyecharts import options as opts
from pyecharts.charts import Pie
from pyecharts.faker import Faker
from pyecharts.globals import CurrentConfig

CurrentConfig.ONLINE_HOST = 'D:/python/pyecharts-assets-master/assets/'
c = (
    Pie()
    .add(
        "",
        [list(z) for z in zip(Faker.choose(), Faker.values())],
        radius=["40%", "60%"],
        label_opts=opts.LabelOpts(
            position="outside",
            formatter="{a|{a}}{abg|}\n{hr|}\n {b|{b}: }{c}  {per|{d}%}  ",
            background_color="#eee",
            border_color="#aaa",
            border_width=1,
            border_radius=4,
            rich={
                "a": {"color": "#999", "lineHeight": 22, "align": "center"},
                "abg": {
                    "backgroundColor": "#e3e3e3",
                    "width": "100%",
                    "align": "right",
                    "height": 22,
                    "borderRadius": [4, 4, 0, 0],
                },
                "hr": {
                    "borderColor": "#aaa",
                    "width": "100%",
                    "borderWidth": 0.5,
                    "height": 0,
                },
                "b": {"fontSize": 16, "lineHeight": 33},
                "per": {
                    "color": "#eee",
                    "backgroundColor": "#334455",
                    "padding": [2, 4],
                    "borderRadius": 2,
                },
            },
        ),
    )
    .set_global_opts(title_opts=opts.TitleOpts(title="Pie-富文本示例"))
    .render("pie_rich_label.html")
)
运行效果如下:
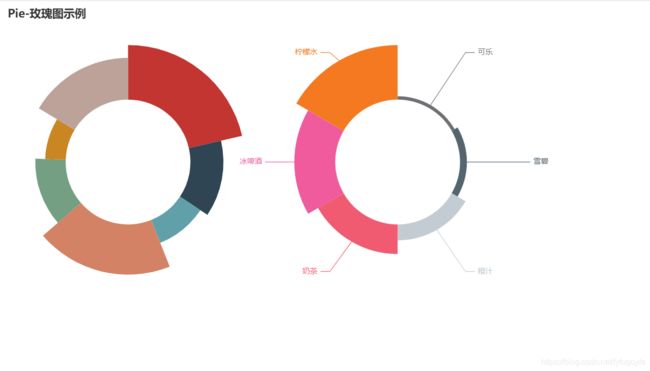
四、玫瑰图
代码如下:
from pyecharts import options as opts
from pyecharts.charts import Pie
from pyecharts.faker import Faker
from pyecharts.globals import CurrentConfig

CurrentConfig.ONLINE_HOST = 'D:/python/pyecharts-assets-master/assets/'
labels = ['可乐', '雪碧', '橙汁', '奶茶', '冰啤酒', '柠檬水']
values = [6, 12, 28, 52, 72, 96]
v = Faker.choose()
c = (
    Pie()
    .add(
        "",
        [list(z) for z in zip(v, Faker.values())],
        radius=["40%", "75%"],
        center=["22%", "50%"],
        rosetype="radius",
        label_opts=opts.LabelOpts(is_show=False),
    )
    .add(
        "",
        [list(z) for z in zip(labels, values)],
        radius=["40%", "75%"],
        center=["70%", "50%"],
        rosetype="area",
    )
    .set_global_opts(title_opts=opts.TitleOpts(title="Pie-玫瑰图示例"),
                     legend_opts=opts.LegendOpts(is_show=False)
                     )
    .render("pie_rosetype.html")
)
from pyecharts import options as opts
from pyecharts.charts import Pie
from pyecharts.globals import CurrentConfig
import pandas as pd

CurrentConfig.ONLINE_HOST = 'D:/python/pyecharts-assets-master/assets/'
provinces = ['北京','上海','黑龙江','吉林','辽宁','内蒙古','新疆','西藏','青海','四川','云南','陕西','重庆',
             '贵州','广西','海南','澳门','湖南','江西','福建','安徽','浙江','江苏','宁夏','山西','河北','天津']
num = [1,1,1,17,9,22,23,42,35,7,20,21,16,24,16,21,37,12,13,14,13,7,22,8,16,13,13]
color_series = ['#FAE927','#E9E416','#C9DA36','#9ECB3C','#6DBC49',
                '#37B44E','#3DBA78','#14ADCF','#209AC9','#1E91CA',
                '#2C6BA0','#2B55A1','#2D3D8E','#44388E','#6A368B'
                '#7D3990','#A63F98','#C31C88','#D52178','#D5225B',
                '#D02C2A','#D44C2D','#F57A34','#FA8F2F','#D99D21',
                '#CF7B25','#CF7B25','#CF7B25']

# 创建DataFrame
df = pd.DataFrame({'provinces': provinces, 'num': num})
# 降序排序
df.sort_values(by='num', ascending=False, inplace=True)

# 提取数据
v = df['provinces'].values.tolist()
d = df['num'].values.tolist()
# 绘制饼图
pie1 = Pie(init_opts=opts.InitOpts(width='1250px', height='750px'))
# 设置颜色
pie1.set_colors(color_series)

pie1.add("", [list(z) for z in zip(v, d)],
        radius=["30%", "100%"],
        center=["50%", "50%"],
        rosetype="area"
        )
# 设置全局配置项
pie1.set_global_opts(title_opts=opts.TitleOpts(title='多省区市\n确诊病例连续多日',subtitle='零新增',
                                               title_textstyle_opts=opts.TextStyleOpts(font_size=25,color= '#0085c3'),
                                               subtitle_textstyle_opts= opts.TextStyleOpts(font_size=50,color= '#003399'),
                                               pos_right= 'center',pos_left= 'center',pos_top='42%',pos_bottom='center'
                                              ),
                     legend_opts=opts.LegendOpts(is_show=False),
                     toolbox_opts=opts.ToolboxOpts())
# 设置系列配置项
pie1.set_series_opts(label_opts=opts.LabelOpts(is_show=True, position="inside", font_size=12,
                                               formatter="{b}:{c}天", font_style="italic",
                                               font_weight="bold", font_family="SimHei"
                                               ),
                     )
# 渲染在html页面上
pie1.render('南丁格尔玫瑰图示例.html')
