运动规划——B样条曲线
一、贝塞尔曲线(Bézier curve)
贝塞尔曲线主要用于二维图形应用程序中的数学曲线,曲线由起始点,终止点(也称锚点)和控制点组成,通过调整控制点,通过一定方式绘制的贝塞尔曲线形状会发生变化。
n阶贝塞尔曲线公式
B ( t ) = ∑ i = 0 n C n i P i ( 1 − t ) n − i t i , t ∈ [ 0 , 1 ] B(t) = \sum^n_{i=0} \textrm{C}_{n}^{i}P_i(1-t)^{n-i}t^i,t\in[0,1] B(t)=i=0∑nCniPi(1−t)n−iti,t∈[0,1]
式中 C n i = n ! ( n − i ) ! ⋅ i ! \textrm{C}_{n}^{i} = \frac{n!}{(n-i)! \cdot i! } Cni=(n−i)!⋅i!n!,n阶贝塞尔曲线需要n+1个控制点。
1.2 曲线公式导出
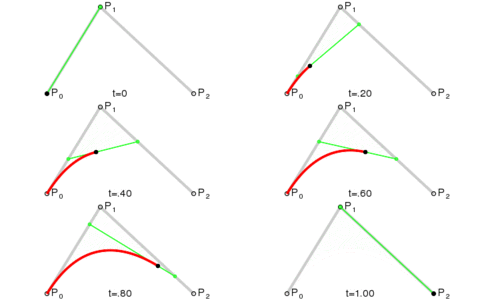
上图为二阶贝塞尔曲线,在 P 0 P 1 P_0P_1 P0P1上利用一阶公式求出点 P 0 ′ P_0^{'} P0′,然后在 P 1 P 2 P_1P_2 P1P2上利用一阶公式求出点 P 1 ′ P_1^{'} P1′,最后在 P 1 ′ P 2 ′ P_1^{'} P_2^{'} P1′P2′上再利用一阶公式就可以求出最终贝塞尔曲线上的点 P 0 ′ ′ P_0^{''} P0′′。
- 线段上的控制点
P 0 ′ = ( 1 − t ) P 0 + t P 1 P 1 ′ = ( 1 − t ) P 1 + t P 2 P_0^{'} = (1 - t)P_0 + tP_1\\ P_1^{'} = (1 - t)P_1 + tP_2 P0′=(1−t)P0+tP1P1′=(1−t)P1+tP2
- 将上面的公式带入至下列公式中
B 2 ( t ) = ( 1 − t ) P 0 ′ + t P 1 ′ = ( 1 − t ) ( ( 1 − t ) P 0 + t P 1 ) + t ( ( 1 − t ) P 1 + t P 2 ) = ( 1 − t ) 2 P 0 + 2 t ( 1 − t ) P 1 + t 2 P 2 \begin{aligned} B_{2}(t) &= (1 - t)P_0^{'} + tP_1^{'}\\ &= (1 - t)((1 - t)P_0 + tP_1) + t((1 - t)P_1 + tP_2)\\ &= (1 - t)^2P_0 + 2t(1 - t)P_1 + t^2P_2 \end{aligned} B2(t)=(1−t)P0′+tP1′=(1−t)((1−t)P0+tP1)+t((1−t)P1+tP2)=(1−t)2P0+2t(1−t)P1+t2P2
- 曲线公式
B 2 ( t ) = P 0 ( 1 − t ) 2 + 2 P 1 ( 1 − t ) t + P 2 t 2 , t ∈ [ 0 , 1 ] B_{2}(t) = P_0(1 - t)^2 + 2P_1(1 - t)t + P_2 t^2 , t\in[0, 1] B2(t)=P0(1−t)2+2P1(1−t)t+P2t2,t∈[0,1]
- 标准化
B 2 ( t ) = C 2 0 P 0 ( 1 − t ) 2 − 0 t 0 + C 2 1 P 1 ( 1 − t ) 2 − 1 t 1 + C 2 2 P 2 ( 1 − t ) 2 − 2 t 2 , t ∈ [ 0 , 1 ] B_{2}(t) = C_2^0 P_0 (1 - t)^{2-0}t^0+ C_2^1 P_1 (1 - t)^{2-1}t^1 + C_2^2 P_2 (1 - t)^{2-2}t^2 , t\in[0, 1] B2(t)=C20P0(1−t)2−0t0+C21P1(1−t)2−1t1+C22P2(1−t)2−2t2,t∈[0,1]
注意:详细可参考深入理解贝塞尔曲线
二、B样条曲线(B-Spline)
B-样条是贝塞尔曲线(Bézier curve)的一种一般化,B样条不能表示一些基本的曲线,比如圆,所以引入了NURBS,可以进一步推广为非均匀有理B-样条(NURBS)
2.1 基本概念
-
节点(knot)
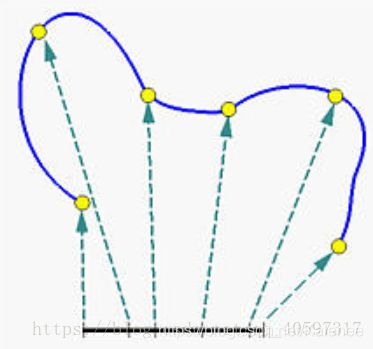
样条曲线(蓝色曲线)映射到定义域(底部黑线)内,在定义域内的点称为节点,定义域范围并不固定,一般使用[0,1]
-
节点点(knot point)
为节点在曲线上的对应点,图上黄色点
-
节点矢量(knot vector)

对应的节点矢量: [ 0 1 7 2 7 3 7 4 7 5 7 6 7 1 ] [0 \ \frac{1}{7} \ \frac{2}{7} \ \frac{3}{7} \ \frac{4}{7} \ \frac{5}{7} \ \frac{6}{7} \ 1] [0 71 72 73 74 75 76 1]
节点向量 U = u 0 , ⋯ , u m U={u_0, \cdots , u_m} U=u0,⋯,um为一个非递减数的集合,将定义域划分为几个区间,当节点在不同区间,采用不同计算,需要满足 m = n + k + 1 m = n+k+1 m=n+k+1(n为控制点数量,k为次数)
-
系数(spline coefficients)

每个系数对应一个控制点 P i = p 0 , ⋯ , p n P_i={p_0, \cdots , p_n} Pi=p0,⋯,pn,控制点为输入路径点,程序根据控制点拟合样条曲线 -
基函数的次数(B-spline order)
样条基函数的次数 k k k
2.2 样条曲线公式
p ( u ) = ∑ i = 0 n d i N i , k ( u ) p(u) = \sum^n_{i=0} d_i N_{i,k}(u) p(u)=i=0∑ndiNi,k(u)
p ( u ) p(u) p(u)为曲线点, u u u为节点域内的细分, d i d_i di为控制点, N i , k ( u ) N_{i,k}(u) Ni,k(u)为基函数。
2.3 曲线分类
2.3.1 均匀B样条曲线
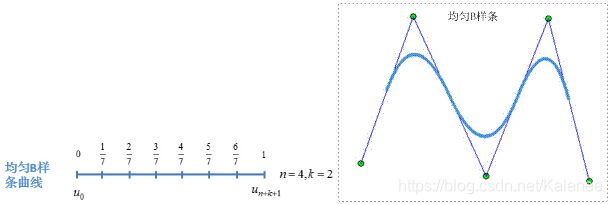
注意:均匀B样条曲线一般来说无法通过起始点和终点,在生成曲线时,需要调整生成曲线的区间(小于 [ 0 , 1 ] [0,1] [0,1]),否则生成的曲线有部分无法使用,一般不太建议采用均匀B样条曲线
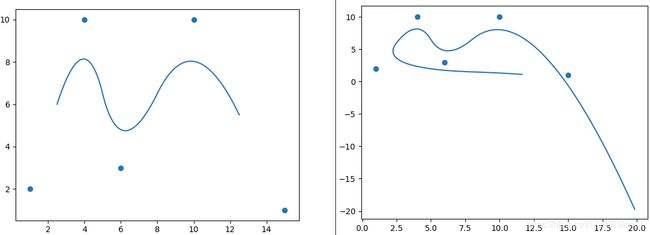
2.3.2 准均匀B样条曲线
节点矢量中两端节点具有重复度k+1,内节点均匀分布重复度为1。
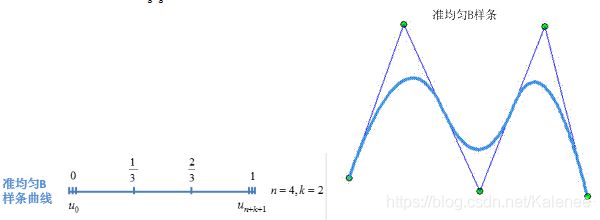
2.3.3 分段Bezier曲线
节点矢量中两端节点的重复度k+1,内节点重复度为k,条件 n k = 正 整 数 \frac{n}{k} = 正整数 kn=正整数

2.4 程序实现
-
scipy.interpolate.BSpline
-
B-Spline Geometry
from geomdl import BSpline

# 创建三维B样条曲线
curve = BSpline.Curve()
# 设置曲线次数k
curve.degree = 3
# 设置控制点
curve.ctrlpts = [[10, 5, 10], [10, 20, -30], [40, 10, 25], [-10, 5, 0]]
# 设置节点矢量
curve.knotvector = [0, 0, 0, 0, 1, 1, 1, 1]
# 设置递增步距,生成总点数为1/0.05=20
curve.delta = 0.05
# 获取曲线点
curve_points = curve.evalpts
- 自己实现
import numpy as np
import math
from matplotlib import pyplot as plt
from mpl_toolkits.mplot3d import Axes3D

class B_Splines_Class:
    def __init__(self,d,k):
        '''
        d:控制点
        k:曲线次数
        '''
        self.d = d
        self.d_n = len(d)
        self.k = k

        #self.NodeVector = np.linspace(0,1,self.d_n + self.k + 1).tolist() # 均匀
        self.NodeVector = self.U_semiequal(self.d_n,self.k)           # 准均匀


    def gen_spline(self):
        _path = []
        u = 0.0# 起点,默认使用[0,1]
        while u <= 1.0-0.0:# 终点
            point = sum(self.d[i] * self.BaseFunction(i, self.k, u, self.NodeVector) for i in range(self.d_n))
            _path.append(point.tolist())
            u = u + 0.001# 步距

        return _path


    def BaseFunction(self,i,k,u,NodeVector):
        if k == 0:
            return 1.0 if NodeVector[i] <= u < NodeVector[i+1] else 0.0

        #计算基函数
        if NodeVector[i+k] == NodeVector[i]:
            c1 = 0.0
        else:
            c1 = (u - NodeVector[i])/(NodeVector[i+k] - NodeVector[i]) * self.BaseFunction(i, k-1, u, NodeVector)

        if NodeVector[i+k+1] == NodeVector[i+1]:
            c2 = 0.0
        else:
            c2 = (NodeVector[i+k+1] - u)/(NodeVector[i+k+1] - NodeVector[i+1]) * self.BaseFunction(i+1, k-1, u, NodeVector)

        return c1 + c2


    def U_semiequal(self,n,k):
        # 准均匀
        piecewise = n - k     #曲线的段数
        if piecewise == 1:    # 一段曲线
            NodeVector = np.ones(n+k+1)
        else:                 # 多段曲线
            NodeVector = np.zeros(n+k+1)
            flag = 0
            while flag != piecewise:
                NodeVector[k+1+flag] =  NodeVector[k+flag] + 1.0/piecewise
                flag = flag+1
            NodeVector[n:] = 1

        return NodeVector.tolist()

if __name__=='__main__':
    # 二维
    # d = np.array([[1,2],[2,4],[3,8],[4,9],[6,9],[7,11],[8,15]])
    # 三维
    d = np.array([[10, 5, 10], [10, 20, -30], [40, 10, 25], [-10, 5, 0]])
    k = 2
    test = B_Splines_Class(d,k)
    path = test.gen_spline()

    # 绘图
    # 二维
    # plt.plot([x[0] for x in path],[y[1] for y in path])
    # plt.scatter([x[0] for x in d],[y[1] for y in d])

    # 三维
    fig = plt.figure()
    ax = Axes3D(fig)
    ax.plot([x[0] for x in path],[y[1] for y in path],[z[2] for z in path])
    ax.scatter([x[0] for x in d],[y[1] for y in d],[z[2] for z in d])

    plt.show()
参考
深入理解贝塞尔曲线
1.4.2 B-spline curve - MIT
贝兹曲线(Bezier)和nurms(NURMS)曲线有什么关系吗?
B样条曲线曲面(附代码)
B样条曲线(B-spline Curves)
B-样条曲线教程(B-spline Curves Notes)目录
matlab-B-splines
motionLib
