python数据可视化学习1-画直方图
import numpy as np
import matplotlib.pyplot as plt
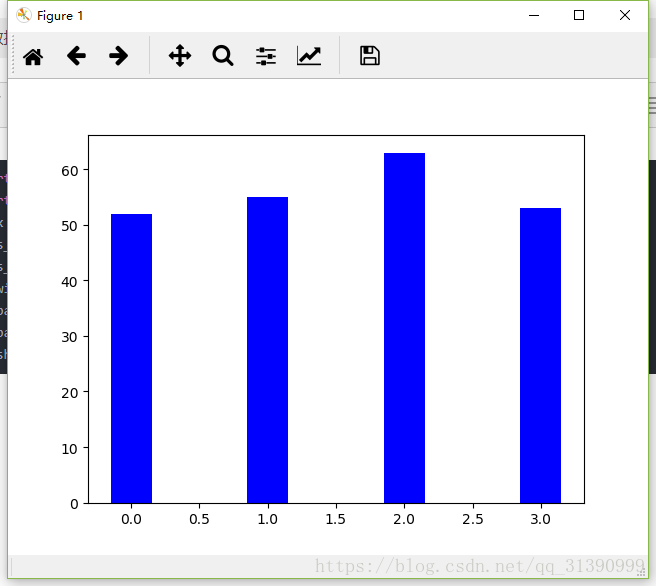
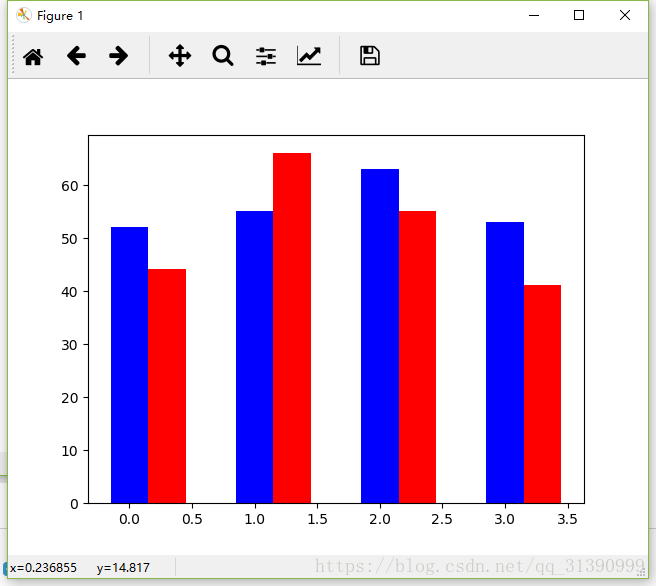
index = np.arange(4)
sales_BJ =[52,55,63,53]
sales_SH = [44,66,55,41]
bar_width=0.3
plt.bar(index,sales_BJ,bar_width,color='b')
//plt.bar(index+bar_width,sales_SH,bar_width,color='r')
plt.bar(index,sales_SH,bar_width,color='r',bottom=sales_BJ)
plt.show()


