matlab画图
1、数据
x = -10:0.1:10;         %生成从-10到10的步长为0.1的向量
y1 = x.^2+10;           %“^”幂指数运算,“.^”向量或矩阵内各元素幂指数运算
y2 = x.^2+20;
y3 = x.^2+30;
2、绘制在同一图像中
(1)方法1
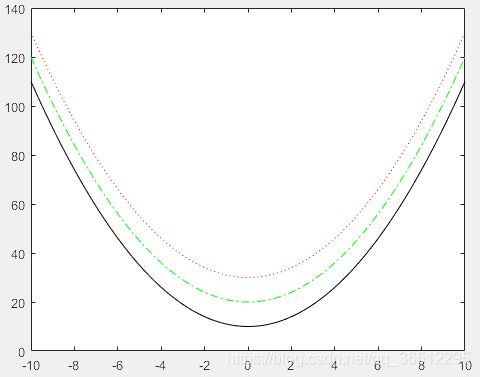
plot(x,y1,'k-',x,y2,'g-.',x,y3,'r:') %将三条曲线绘制在同一图中(2)方法2(建议)
figure 创建显示图像的窗口对象
hold on 保持当前图像被刷新,接受之后绘制的图形
hold off 关闭图形保持功能,新图出现时,删除原图重新绘制
figure
    plot(x,y1,'k-')
    hold on               %hold on保持当前图像被刷新,接受之后绘制的图形
    plot(x,y2,'g-.')
    hold on
    plot(x,y3,'r:')
3、图像信息绘制
legend() 图例
xlable()、ylable() x轴、y轴说明
title() 图像标题
text(x,y,'说明') 坐标(x,y)处说明
figure
    plot(x,y1,'k-')
    hold on               %hold on保持当前图像被刷新,接受之后绘制的图形
    plot(x,y2,'g-.')
    hold on
    plot(x,y3,'r:')

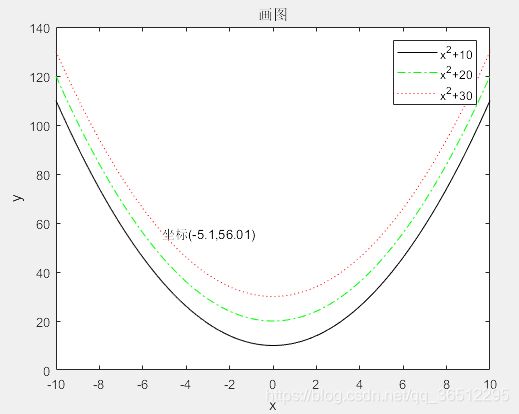
    legend( 'x^2+10','x^2+20','x^2+30')         %图例
    xlabel('x')         %x轴说明
    ylabel('y')         %y轴说明
    title('画图')       %图像标题
    text(x(50),y3(50),['坐标(' num2str(x(50),3) ',' num2str(y3(50),4) ')'])      %坐标(x,y)处说明
4、绘制多图
x = -10:0.1:10;         %生成从-10到10的步长为0.1的向量

y1 = x.^2+10;           %“^”幂指数运算,“.^”向量或矩阵内各元素幂指数运算
y2 = x.^2+20;
y3 = x.^2+30;

y4 = -x.^2+10;
y5 = -x.^2+20;
y6 = -x.^2+30;

figure
    plot(x,y1,'k-')
    hold on               %hold on保持当前图像被刷新,接受之后绘制的图形
    plot(x,y2,'g-.')
    hold on
    plot(x,y3,'r:')

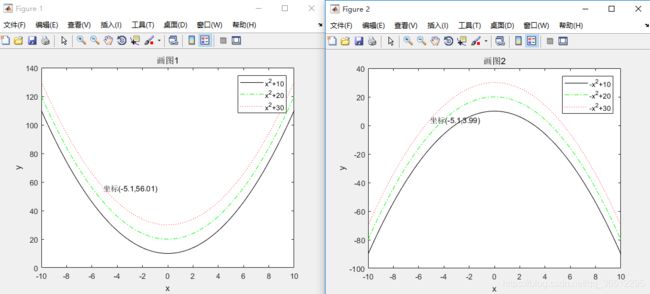
    legend( 'x^2+10','x^2+20','x^2+30')         %图例
    xlabel('x')         %x轴说明
    ylabel('y')         %y轴说明
    title('画图1')       %图形名称
    text(x(50),y3(50),['坐标(' num2str(x(50),3) ',' num2str(y3(50),4) ')'])     %图形说明

figure
    plot(x,y4,'k-')
    hold on
    plot(x,y5,'g-.')
    hold on
    plot(x,y6,'r:')

    legend('-x^2+10','-x^2+20','-x^2+30')
    xlabel('x')
    ylabel('y')
    title('画图2')
    text(x(50),y6(50),['坐标(' num2str(x(50),3) ',' num2str(y6(50),4) ')'])
5、绘制在多个子图中
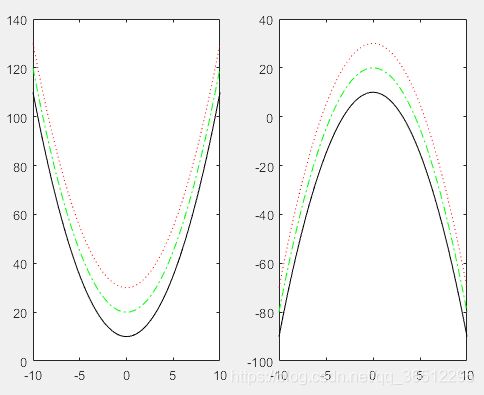
subplot(x,y,n)中x表示显示的行数,y表示列数,n表示第几幅图片
figure
    subplot(1,2,1)       %1行2列的第1个子图
    plot(x,y1,'k-')
    hold on
    plot(x,y2,'g-.')
    hold on
    plot(x,y3,'r:')

    subplot(1,2,2)       %1行2列的第2个子图
    plot(x,y4,'k-')
    hold on
    plot(x,y5,'g-.')
    hold on
    plot(x,y6,'r:')
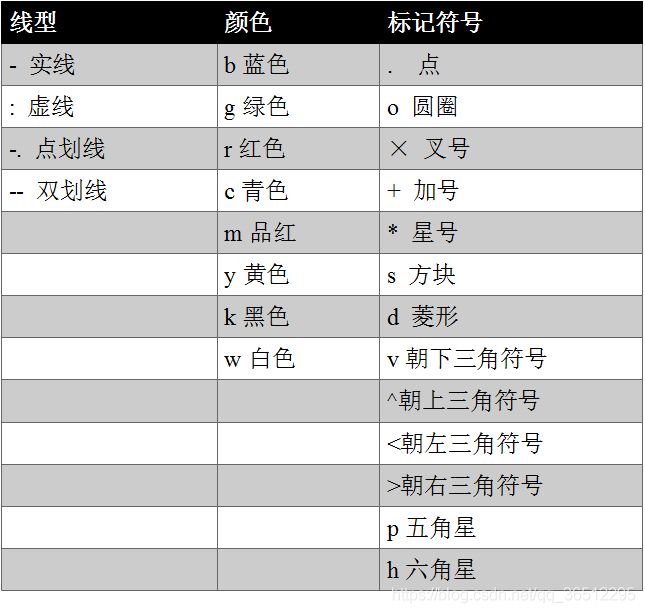
6、附:线型、颜色、标记符号信息
