【127】TensorFlow对特征值分箱并使用独热编码
我使用加利福尼亚州房价数据来作例子。训练集和验证集用到的CSV文件在这里:https://download.csdn.net/download/zhangchao19890805/10584496
测试集用到的CSV文件在这里:
https://download.csdn.net/download/zhangchao19890805/10631336
在实际应用的时候,许多特征值和标签之间不是线性关系。
那么该如何处理这种特征值呢?
有两种思路回答此问题:
- 设计复杂的数学公式,并利用数据对模型进行训练,获得各个同类项的权重。比如把简单的 y = w0 + w1x 改成复杂的 y = w0 + w1x2 + w2x
- 使用分箱技术。把特征值分布的数值范围分成若干段,记录下每条数据落在那一段。使用独热编码的办法,把每一段转换成一项特征值,然后用零和一标记每条数据落在哪一段。这是一种思考起来较为简便的方法,更容易让人理解。
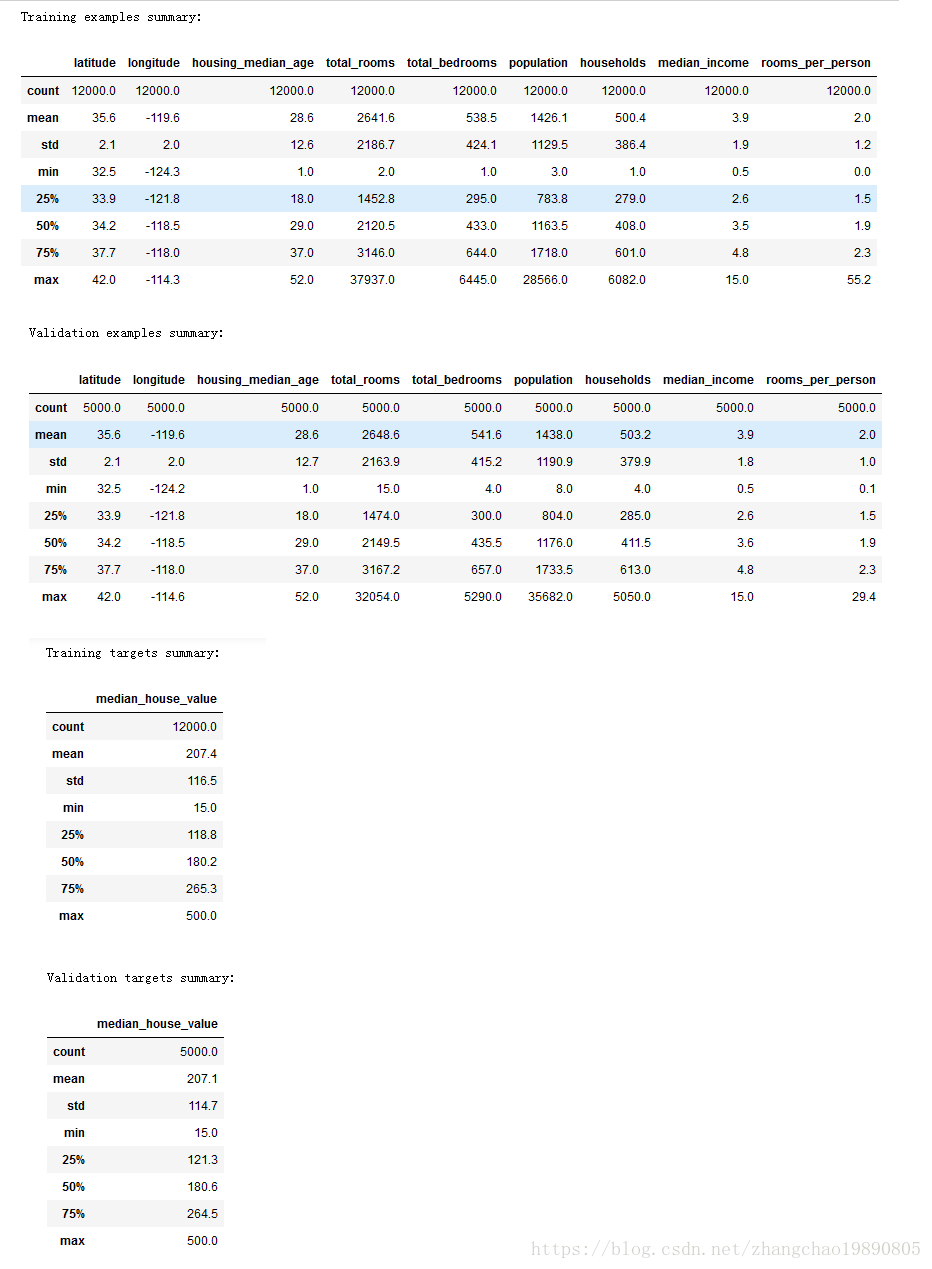
本文用分箱加独热编码的方法编写DEMO。同上篇文章一样,使用了加利福尼亚州房价的数据源。按照惯例,先展示数据的概要信息,这是处理数据的良好习惯。代码是 ZcSummary 类。
import tensorflow as tf
import numpy as np
import matplotlib.pyplot as plt
import pandas as pd
import math
from sklearn import metrics
from IPython import display

class ZcSummary:
    # 从CSV文件中读取数据,返回DataFrame类型的数据集合。
    def read_csv(self):
        v_dataframe = pd.read_csv("http://114.116.18.230/california_housing_train.csv", sep=",")
        # 打乱数据集合的顺序。有时候数据文件有可能是根据某种顺序排列的,会影响到我们对数据的处理。
        v_dataframe = v_dataframe.reindex(np.random.permutation(v_dataframe.index))
        return v_dataframe

    # 预处理特征值
    def preprocess_features(self, california_housing_dataframe):
        selected_features = california_housing_dataframe[
            ["latitude",
             "longitude",
             "housing_median_age",
             "total_rooms",
             "total_bedrooms",
             "population",
             "households",
             "median_income"]
        ]
        processed_features = selected_features.copy()
        # 增加一个新属性:人均房屋数量。
        processed_features["rooms_per_person"] = (
            california_housing_dataframe["total_rooms"] /
            california_housing_dataframe["population"])
        return processed_features


    # 预处理标签
    def preprocess_targets(self, california_housing_dataframe):
        output_targets = pd.DataFrame()
        # 数值过大可能引起训练过程中的错误。因此要把房价数值先缩小成原来的
        # 千分之一,然后作为标签值返回。
        output_targets["median_house_value"] = (
            california_housing_dataframe["median_house_value"] / 1000.0)
        return output_targets

     # 主函数
    def main(self):
        tf.logging.set_verbosity(tf.logging.ERROR)
        pd.options.display.max_rows = 10
        pd.options.display.float_format = '{:.1f}'.format

        california_housing_dataframe = self.read_csv()
        # 对于训练集,我们从共 17000 个样本中选择前 12000 个样本。
        training_examples = self.preprocess_features(california_housing_dataframe.head(12000))
        training_targets = self.preprocess_targets(california_housing_dataframe.head(12000))
        # 对于验证集,我们从共 17000 个样本中选择后 5000 个样本。
        validation_examples = self.preprocess_features(california_housing_dataframe.tail(5000))
        validation_targets = self.preprocess_targets(california_housing_dataframe.tail(5000))

        # 展示数据集的概要情况。
        print("Training examples summary:")
        display.display(training_examples.describe())
        print("Validation examples summary:")
        display.display(validation_examples.describe())

        print("Training targets summary:")
        display.display(training_targets.describe())
        print("Validation targets summary:")
        display.display(validation_targets.describe())


t = ZcSummary()
t.main()
运行结果:
为了节约篇幅,我们使用了上篇文章:【126】TensorFlow 使用皮尔逊相关系数找出和标签相关性最大的特征值 中得到的结论。使用 median_income 和 latitude 这两个特征值来训练模型。
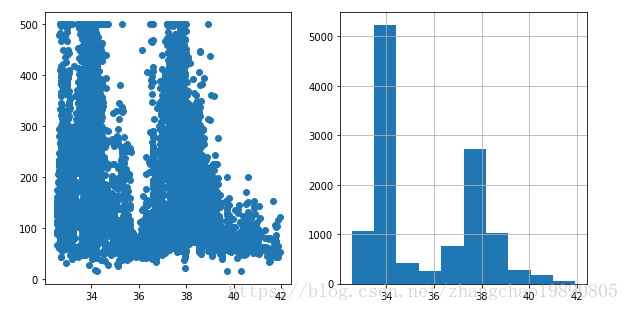
我们先检查维度 latitude 和房价 median_house_value 是否是线性关系,检查方法是查看散点图。当发现没有线性关系的时候,查看直方图,观察 latitude 的分布情况。我用 ZcCheck 类完成了以上工作:
import tensorflow as tf
import numpy as np
import matplotlib.pyplot as plt
import pandas as pd
import math
from sklearn import metrics
from IPython import display

class ZcCheck:
    # 从CSV文件中读取数据,返回DataFrame类型的数据集合。
    def read_csv(self):
        v_dataframe = pd.read_csv("http://114.116.18.230/california_housing_train.csv", sep=",")
        # 打乱数据集合的顺序。有时候数据文件有可能是根据某种顺序排列的,会影响到我们对数据的处理。
        v_dataframe = v_dataframe.reindex(np.random.permutation(v_dataframe.index))
        return v_dataframe

    # 预处理特征值
    def preprocess_features(self, california_housing_dataframe):
        selected_features = california_housing_dataframe[
            ["latitude",
             "longitude",
             "housing_median_age",
             "total_rooms",
             "total_bedrooms",
             "population",
             "households",
             "median_income"]
        ]
        processed_features = selected_features.copy()
        # 增加一个新属性:人均房屋数量。
        processed_features["rooms_per_person"] = (
            california_housing_dataframe["total_rooms"] /
            california_housing_dataframe["population"])
        return processed_features


    # 预处理标签
    def preprocess_targets(self, california_housing_dataframe):
        output_targets = pd.DataFrame()
        # 数值过大可能引起训练过程中的错误。因此要把房价数值先缩小成原来的
        # 千分之一,然后作为标签值返回。
        output_targets["median_house_value"] = (
            california_housing_dataframe["median_house_value"] / 1000.0)
        return output_targets

     # 主函数
    def main(self):
        tf.logging.set_verbosity(tf.logging.ERROR)
        pd.options.display.max_rows = 10
        pd.options.display.float_format = '{:.1f}'.format

        california_housing_dataframe = self.read_csv()
        # 对于训练集,我们从共 17000 个样本中选择前 12000 个样本。
        training_examples = self.preprocess_features(california_housing_dataframe.head(12000))
        training_targets = self.preprocess_targets(california_housing_dataframe.head(12000))
        # 对于验证集,我们从共 17000 个样本中选择后 5000 个样本。
        validation_examples = self.preprocess_features(california_housing_dataframe.tail(5000))
        validation_targets = self.preprocess_targets(california_housing_dataframe.tail(5000))

        # 检查纬度latitude和房价之间是不是线性关系。
        fig = plt.figure()
        fig.set_size_inches(15,5)
        ax = fig.add_subplot(1,3,1)
        ax.scatter(training_examples["latitude"], training_targets["median_house_value"])

        # 发现latitude和房价之间不是线性关系后,检查latitude的分布情况,方便决定
        # latitude 如何分桶。
        ax = fig.add_subplot(1,3,2)
        ax = training_examples["latitude"].hist()
        plt.show()

t = ZcCheck()
t.main()
运行结果:
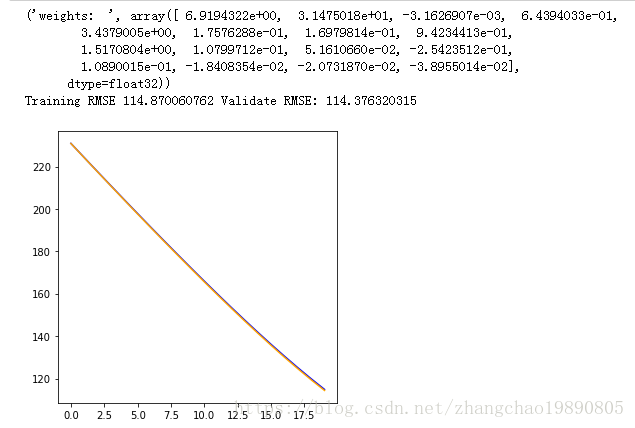
先在通过直方图,我们了解了 latitude 的分布范围。先在可以对 latitude 分箱,然后使用独热编码训练模型。具体操作在 ZcTrain 类中:
import tensorflow as tf
import numpy as np
import matplotlib.pyplot as plt
import pandas as pd
import math
from sklearn import metrics
from IPython import display


class ZcTrain:
    # 从CSV文件中读取数据,返回DataFrame类型的数据集合。
    def read_csv(self):
        v_dataframe = pd.read_csv("http://114.116.18.230/california_housing_train.csv", sep=",")
        # 打乱数据集合的顺序。有时候数据文件有可能是根据某种顺序排列的,会影响到我们对数据的处理。
        v_dataframe = v_dataframe.reindex(np.random.permutation(v_dataframe.index))
        return v_dataframe


    # 预处理特征值
    def preprocess_features(self, california_housing_dataframe):
        selected_features = california_housing_dataframe[
            ["latitude",
             "longitude",
             "housing_median_age",
             "total_rooms",
             "total_bedrooms",
             "population",
             "households",
             "median_income"]
        ]
        processed_features = selected_features.copy()
        # 增加一个新属性:人均房屋数量。
        processed_features["rooms_per_person"] = (
            california_housing_dataframe["total_rooms"] /
            california_housing_dataframe["population"])
        return processed_features


    # 预处理标签
    def preprocess_targets(self, california_housing_dataframe):
        output_targets = pd.DataFrame()
        # Scale the target to be in units of thousands of dollars.
        output_targets["median_house_value"] = (
            california_housing_dataframe["median_house_value"] / 1000.0)
        return output_targets


    # 根据数学模型计算预测值。公式是 y = w0 + w1 * x1 + w2 * x2 .... + wN * xN
    def fn_predict(self, pa_dataframe, pa_weight_arr):
        v_result = []
        v_weight_num = len(pa_weight_arr)
        for var_row_index in pa_dataframe.index:
            y = pa_weight_arr[0]
            for v_index in range(v_weight_num-1):
                y = y + pa_weight_arr[v_index + 1] * pa_dataframe.loc[var_row_index].values[v_index]
            v_result.append(y)
        return v_result


    # 训练形如 y = w0 + w1 * x1 + w2 * x2 + ...  的直线模型。x1 x2 ...是自变量,
    # w0 是常数项,w1 w2 ... 是对应自变量的权重。
    # feature_arr 特征值的矩阵。每一行是 [1.0, x1_data, x2_data, ...]
    # label_arr 标签的数组。相当于 y = kx + b 中的y。
    # training_steps 训练的步数。即训练的迭代次数。
    # period         误差报告粒度
    # learning_rate 在梯度下降算法中,控制梯度步长的大小。
    def fn_train_line(self, feature_arr, label_arr, validate_feature_arr, validate_label_arr, training_steps, periods, learning_rate):
        feature_tf_arr = feature_arr
        label_tf_arr = np.array([[e] for e in label_arr]).astype(np.float32)
        # 整个训练分成若干段,即误差报告粒度,用periods表示。
        # steps_per_period 表示平均每段有多少次训练
        steps_per_period = training_steps / periods
        # 存放 L2 损失的数组
        loss_arr = []
        # 权重数组的长度。也就是权重的个数。
        weight_arr_length = len(feature_arr[0])
        # 开启TF会话,在TF 会话的上下文中进行 TF 的操作。
        with tf.Session() as sess:
            # 训练集的均方根误差RMSE。这是保存误差报告的数组。
            train_rmse_arr = []
            # 验证集的均方根误差RMSE。
            validate_rmse_arr = []

            # 设置 tf 张量(tensor)。注意:TF会话中的注释里面提到的常量和变量是针对TF设置而言,不是python语法。

            # 因为在TF运算过程中,x作为特征值,y作为标签
            # 是不会改变的,所以分别设置成input 和 target 两个常量。
            # 这是 x 取值的张量。设一共有m条数据,可以把input理解成是一个m行2列的矩阵。矩阵第一列都是1,第二列是x取值。
            input = tf.constant(feature_tf_arr)
            # 设置 y 取值的张量。target可以被理解成是一个m行1列的矩阵。 有些文章称target为标签。
            target = tf.constant(label_tf_arr)

            # 设置权重变量。因为在每次训练中,都要改变权重,来寻找L2损失最小的权重,所以权重是变量。
            # 可以把权重理解成一个多行1列的矩阵。初始值是随机的。行数就是权重数。
            weights = tf.Variable(tf.random_normal([weight_arr_length, 1], 0, 0.1))

            # 初始化上面所有的 TF 常量和变量。
            tf.global_variables_initializer().run()
            # input 作为特征值和权重做矩阵乘法。m行2列矩阵乘以2行1列矩阵,得到m行1列矩阵。
            # yhat是新矩阵,yhat中的每个数 yhat' = w0 * 1 + w1 * x1 + w2 * x2 ...。
            # yhat是预测值,随着每次TF调整权重,yhat都会变化。
            yhat = tf.matmul(input, weights)
            # tf.subtract计算两个张量相减,当然两个张量必须形状一样。 即 yhat - target。
            yerror = tf.subtract(yhat, target)
            # 计算L2损失,也就是方差。
            loss = tf.nn.l2_loss(yerror)
            # 梯度下降算法。
            zc_optimizer = tf.train.GradientDescentOptimizer(learning_rate)
            # 注意:为了安全起见,我们还会通过 clip_gradients_by_norm 将梯度裁剪应用到我们的优化器。
            # 梯度裁剪可确保梯度大小在训练期间不会变得过大,梯度过大会导致梯度下降法失败。
            zc_optimizer = tf.contrib.estimator.clip_gradients_by_norm(zc_optimizer, 5.0)
            zc_optimizer = zc_optimizer.minimize(loss)
            for _ in range(periods):
                for _ in range(steps_per_period):
                    # 重复执行梯度下降算法,更新权重数值,找到最合适的权重数值。
                    sess.run(zc_optimizer)
                    # 每次循环都记录下损失loss的值,并放到数组loss_arr中。
                    loss_arr.append(loss.eval())
                v_tmp_weight_arr = weights.eval()
                # 计算均方根误差。其中 np.transpose(yhat.eval())[0] 把列向量转换成一维数组
                train_rmse_arr.append(math.sqrt(
                        metrics.mean_squared_error(np.transpose(yhat.eval())[0], label_tf_arr)))
                validate_rmse_arr.append(math.sqrt(
                        metrics.mean_squared_error(self.fn_predict(validate_feature_arr, v_tmp_weight_arr), validate_label_arr)))
            # 把列向量转换成一维数组
            zc_weight_arr = np.transpose(weights.eval())[0]
            zc_yhat = np.transpose(yhat.eval())[0]
        return (zc_weight_arr, zc_yhat, loss_arr, train_rmse_arr, validate_rmse_arr)


    # 构建用于训练的特征值。
    # pa_dataframe 原来数据的 Dataframe
    # 本质上是用二维数组构建一个矩阵。里面的每个一维数组都是矩阵的一行,形状类似下面这种形式:
    #    1.0, x1[0], x2[0], x3[0], ...
    #    1.0, x1[1], x2[1], x3[1], ...
    #    .........................
    # 其中x1, x2, x3 表示数据的某个维度,比如:"latitude","longitude","housing_median_age"。
    # 也可以看作是公式中的多个自变量。
    def fn_construct_tf_feature_arr(self, pa_dataframe):
        v_result = []
        # dataframe中每列的名称。
        zc_var_col_name_arr = [e for e in pa_dataframe]
        # 遍历dataframe中的每行。
        for row_index in pa_dataframe.index:
            zc_var_tf_row = [1.0]
            for i in range(len(zc_var_col_name_arr)):
                zc_var_tf_row.append(pa_dataframe.loc[row_index].values[i])
            v_result.append(zc_var_tf_row)
        return v_result

    # 画损失的变化图。
    # pa_ax  Axes
    # pa_arr_train_rmse 训练次数。
    # pa_arr_validate_rmse 损失变化的记录
    def fn_paint_loss(self, pa_ax, pa_arr_train_rmse, pa_arr_validate_rmse):
        pa_ax.plot(range(0, len(pa_arr_train_rmse)), pa_arr_train_rmse, label="training", color="blue")
        pa_ax.plot(range(0, len(pa_arr_validate_rmse)), pa_arr_validate_rmse, label="validate", color="orange")

    # 处理纬度
    # pa_source_df 源数据的DataFrame
    # 返回对 latitude进行独热编码后的 DataFrame
    def fn_process_latitude(self, pa_source_df):
        v_result = pd.DataFrame()
        v_result["median_income"] = pa_source_df["median_income"]
        # 平均分箱
        v_min = 31.5
        v_arr = []
        for v_counter in range(14):
            v_left = v_min + v_counter
            v_right = v_left + 1
            v_arr.append([v_left, v_right])
        # 增加独热编码
        for v_item in v_arr:
            v_key_str = "latitude_" + str(v_item[0]) + "_to_" + str(v_item[1])
            v_result[v_key_str] = pa_source_df["latitude"].apply(
                lambda l: 1.0 if l >= v_item[0] and l < v_item[1] else 0.0)
        return v_result


    # 主函数
    def main(self):
        tf.logging.set_verbosity(tf.logging.ERROR)
        pd.options.display.max_rows = 10
        pd.options.display.float_format = '{:.1f}'.format

        california_housing_dataframe = self.read_csv()
        # 对于训练集,我们从共 17000 个样本中选择前 12000 个样本。
        training_examples = self.preprocess_features(california_housing_dataframe.head(12000))
        training_targets = self.preprocess_targets(california_housing_dataframe.head(12000))
        # 对于验证集,我们从共 17000 个样本中选择后 5000 个样本。
        validation_examples = self.preprocess_features(california_housing_dataframe.tail(5000))
        validation_targets = self.preprocess_targets(california_housing_dataframe.tail(5000))

        # 对latitude进行分箱,处理成独热编码
        v_one_hot_training_examples = self.fn_process_latitude(training_examples)
        v_one_hot_validation_examples =  self.fn_process_latitude(validation_examples)

        # 在模型训练开始之前,做好特征值的准备工作。构建适于训练的矩阵。
        v_train_feature_arr = self.fn_construct_tf_feature_arr(v_one_hot_training_examples)

        (v_weight_arr, v_yhat, v_loss_arr, v_train_rmse_arr, v_validate_rmse_arr) = self.fn_train_line(v_train_feature_arr,
                    training_targets["median_house_value"], v_one_hot_validation_examples,
                    validation_targets["median_house_value"], 500, 20, 0.013)
        # 打印权重
        print("weights:  ", v_weight_arr)
        print("Training RMSE " + str(v_train_rmse_arr[len(v_train_rmse_arr) - 1]) + " Validate RMSE: " +
          str(v_validate_rmse_arr[len(v_validate_rmse_arr) - 1]))

        # 画出损失变化曲线
        fig = plt.figure()
        fig.set_size_inches(5,5)
        self.fn_paint_loss(fig.add_subplot(1,1,1), v_train_rmse_arr, v_validate_rmse_arr)

        plt.show()


t = ZcTrain();
t.main();
用测试集进行测试,使用 ZcValidateTest 类:
import tensorflow as tf
import numpy as np
import matplotlib.pyplot as plt
import pandas as pd
import math
from sklearn import metrics
from IPython import display

class ZcValidateTest:
    # 从CSV文件中读取数据,返回DataFrame类型的数据集合。
    def read_csv(self, pa_url):
        v_dataframe = pd.read_csv(pa_url, sep=",")
        # 打乱数据集合的顺序。有时候数据文件有可能是根据某种顺序排列的,会影响到我们对数据的处理。
        v_dataframe = v_dataframe.reindex(np.random.permutation(v_dataframe.index))
        return v_dataframe


    # 处理纬度
    # pa_source_df 源数据的DataFrame
    # 返回对 latitude进行独热编码后的 DataFrame
    def fn_process_latitude(self, pa_source_df):
        v_result = pd.DataFrame()
        v_result["median_income"] = pa_source_df["median_income"]
        # 平均分箱
        v_min = 31.5
        v_arr = []
        for v_counter in range(14):
            v_left = v_min + v_counter
            v_right = v_left + 1
            v_arr.append([v_left, v_right])
        # 增加独热编码
        for v_item in v_arr:
            v_key_str = "latitude_" + str(v_item[0]) + "_to_" + str(v_item[1])
            v_result[v_key_str] = pa_source_df["latitude"].apply(
                lambda l: 1.0 if l >= v_item[0] and l < v_item[1] else 0.0)
        return v_result


    # 预处理特征值
    def preprocess_features(self, california_housing_dataframe):
        v_selected_features = california_housing_dataframe[
            [
                "median_income",
                "latitude"
             ]
        ]
        result = self.fn_process_latitude(v_selected_features.copy())
        return result


    # 预处理标签
    def preprocess_targets(self, california_housing_dataframe):
        output_targets = pd.DataFrame()
        # 数值过大可能引起训练过程中的错误。因此要把房价数值先缩小成原来的
        # 千分之一,然后作为标签值返回。
        output_targets["median_house_value"] = (
            california_housing_dataframe["median_house_value"] / 1000.0)
        return output_targets

    # 根据数学模型计算预测值。公式是 y = w0 + w1 * x1 + w2 * x2 .... + wN * xN
    def fn_predict(self, pa_dataframe, pa_weight_arr):
        v_result = []
        v_weight_num = len(pa_weight_arr)
        for var_row_index in pa_dataframe.index:
            y = pa_weight_arr[0]
            for v_index in range(v_weight_num-1):
                y = y + pa_weight_arr[v_index + 1] * pa_dataframe.loc[var_row_index].values[v_index]
            v_result.append(y)
        return v_result

     # 主函数
    def main(self):
        tf.logging.set_verbosity(tf.logging.ERROR)
        pd.options.display.max_rows = 10
        pd.options.display.float_format = '{:.1f}'.format

        # 通过训练模型得到的权重
        v_weight_arr = [6.9194322e+00,  3.1475018e+01, -3.1626907e-03,  6.4394033e-01,
        3.4379005e+00,  1.7576288e-01,  1.6979814e-01,  9.4234413e-01,
        1.5170804e+00,  1.0799712e-01,  5.1610660e-02, -2.5423512e-01,
        1.0890015e-01, -1.8408354e-02, -2.0731870e-02, -3.8955014e-02]

        # 读取验证集
        california_housing_dataframe = self.read_csv("http://114.116.18.230/california_housing_train.csv")
        # 对于验证集,我们从共 17000 个样本中选择后 5000 个样本。
        validation_examples = self.preprocess_features(california_housing_dataframe.tail(5000))
        validation_targets = self.preprocess_targets(california_housing_dataframe.tail(5000))
        # 根据已经训练得到的模型系数,计算预验证集的预测值。
        v_validate_predict_arr = self.fn_predict(validation_examples, v_weight_arr)
        # 计算验证集的预测值和标签之间的均方根误差。
        validation_root_mean_squared_error = math.sqrt(
            metrics.mean_squared_error(v_validate_predict_arr, validation_targets["median_house_value"]))
        print("validation RMSE: " + str(validation_root_mean_squared_error))

        # 读取测试集
        test_dataframe = self.read_csv("http://114.116.18.230/california_housing_test.csv")
        test_examples = self.preprocess_features(test_dataframe)
        test_targets = self.preprocess_targets(test_dataframe)
        # 计算测试集的预测值
        v_test_predict_arr = self.fn_predict(test_examples, v_weight_arr)
        # 计算测试集的预测值和标签之间的均方根误差。
        test_root_mean_squared_error = math.sqrt(
                metrics.mean_squared_error(v_test_predict_arr, test_targets["median_house_value"]))
        print("test RMSE: " + str(test_root_mean_squared_error))


t = ZcValidateTest()
t.main()


