无人驾驶工程师学习笔记(七)——Gradient Threshold
利用梯度来检测斜率较大的边缘,他们更可能是车道线。
Sobel Operator
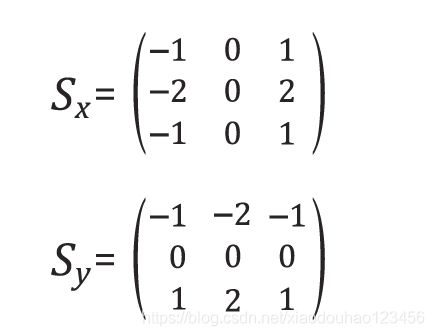
Applying the Sobel operator to an image is a way of taking the derivative of the image in the xx or yy direction.
 These are examples of Sobel operators with a kernel size of 3 (implying a 3 x 3 operator in each case).
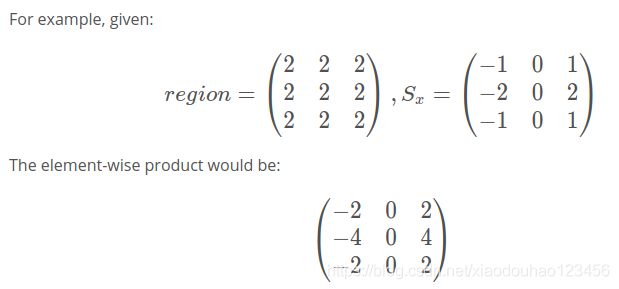
- If the image is flat across that region (i.e., there is little change in values across the given region), then the result will be zero.

 In which case, the sum of this matrix is 0.
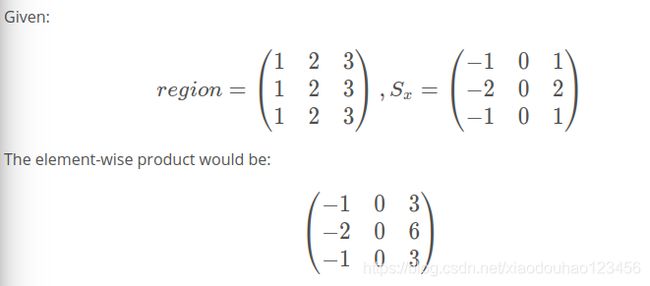
 - If, instead, for example, you apply the Sx operator to a region of the image where values are rising from left to right, then the result will be positive, implying a positive derivative.
 This time, the sum of this matrix is 88, meaning a gradient exists in the x-direction.Note that in this example image region, if you applied the S
y operator, the result would be a gradient of 00 in the y-direction, as the values are not varying from top to bottom.
Sobel Operator code
- first convert it to grayscale:
gray = cv2.cvtColor(img, cv2.COLOR_RGB2GRAY)Use cv2.COLOR_RGB2GRAY if you’ve read in an image using mpimg.imread(). Use cv2.COLOR_BGR2GRAY if you’ve read in an image using cv2.imread().
- Calculate the derivative in the xx direction
sobelx = cv2.Sobel(gray, cv2.CV_64F, 1, 0)- Calculate the derivative in the yy direction (the 0, 1 at the end denotes yy direction):
sobely = cv2.Sobel(gray, cv2.CV_64F, 0, 1)- Calculate the absolute value of the xx derivative:
abs_sobelx = np.absolute(sobelx)- Convert the absolute value image to 8-bit:
scaled_sobel = np.uint8(255*abs_sobelx/np.max(abs_sobelx))numpy中np.max(a, axis=None, out=None, keepdims=False)求序列的最值,最少接受一个参数 axis默认为axis=0即列向,如果axis=1即横向ex:np.max([-2, -1, 0, 1, 2]) 的值为2
It’s not entirely necessary to convert to 8-bit (range from 0 to 255) but in practice, it can be useful in the event that you’ve written a function to apply a particular threshold, and you want it to work the same on input images of different scales, like jpg vs. png. You could just as well choose a different standard range of values, like 0 to 1 etc.
- Create a binary threshold to select pixels based on gradient strength:
thresh_min = 20
thresh_max = 100
sxbinary = np.zeros_like(scaled_sobel)
sxbinary[(scaled_sobel >= thresh_min) & (scaled_sobel <= thresh_max)] = 1
plt.imshow(sxbinary, cmap='gray')
Sobel Operator code example
import numpy as np
import cv2
import matplotlib.pyplot as plt
import matplotlib.image as mpimg
import pickle


# Read in an image and grayscale it
image = mpimg.imread('signs_vehicles_xygrad.png')

# Define a function that applies Sobel x or y,
# then takes an absolute value and applies a threshold.
# Note: calling your function with orient='x', thresh_min=20, thresh_max=100
# should produce output like the example image shown above this quiz.
def abs_sobel_thresh(img, orient='x', thresh_min=0, thresh_max=255):

    # Apply the following steps to img
    # 1) Convert to grayscale
    gray = cv2.cvtColor(img, cv2.COLOR_RGB2GRAY)
    # 2) Take the derivative in x or y given orient = 'x' or 'y'
    if orient == 'x' :
        sobelx = cv2.Sobel(gray, cv2.CV_64F, 1, 0)
        # 3) Take the absolute value of the derivative or gradient
        abs_sobel = np.absolute(sobelx)

    if orient == 'y':
        sobely = cv2.Sobel(gray, cv2.CV_64F, 0, 1)
        abs_sobel = np.absolute(sobely)
    # 4) Scale to 8-bit (0 - 255) then convert to type = np.uint8
    scaled_sobel = np.uint8(255*abs_sobel/np.max(abs_sobel))
    # 5) Create a mask of 1's where the scaled gradient magnitude
            # is > thresh_min and < thresh_max
    sxbinary = np.zeros_like(scaled_sobel)
    sxbinary[(scaled_sobel >= thresh_min) & (scaled_sobel <= thresh_max)] = 1
    # 6) Return this mask as your binary_output image
    plt.imshow(sxbinary, cmap='gray')
    plt.show()
    #binary_output = np.copy(img) # Remove this line
    return sxbinary#二值化后的图像数组

# Run the function
grad_binary = abs_sobel_thresh(image, orient='x', thresh_min=20, thresh_max=100)
# Plot the result
f, (ax1, ax2) = plt.subplots(1, 2, figsize=(24, 9))
#fig, ax = plt.subplots(1,3,figsize=(15,7)),这样就会有1行3个15x7大小的子图。函数返回一个figure图像和子图ax的array列表。
f.tight_layout()
#tight_layout()可以接受关键字参数pad、w_pad或者h_pad,这些参数图像边界和子图之间的额外边距。边距以字体大小单位规定。
ax1.imshow(image)
ax1.set_title('Original Image', fontsize=50)
ax2.imshow(grad_binary, cmap='gray')
ax2.set_title('Thresholded Gradient', fontsize=50)
plt.subplots_adjust(left=0., right=1, top=0.9, bottom=0.)