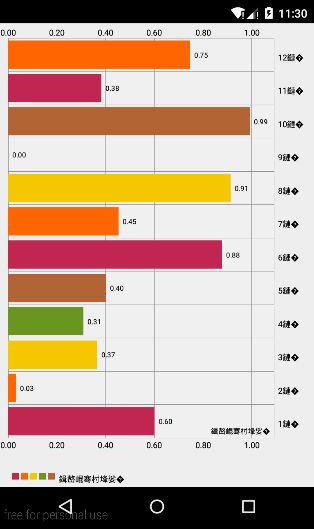
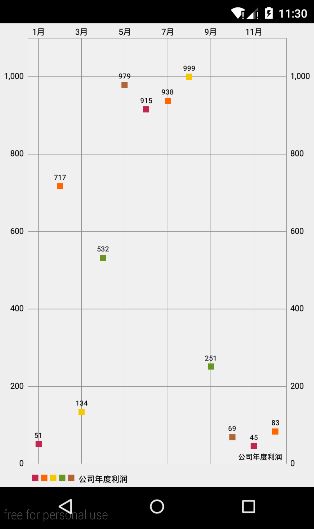
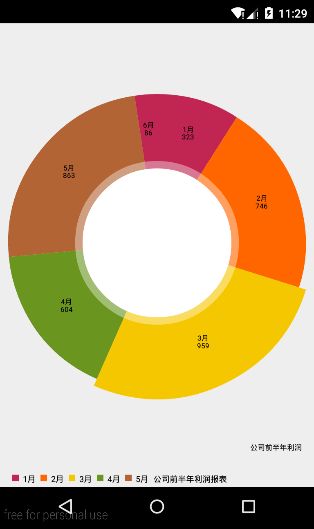
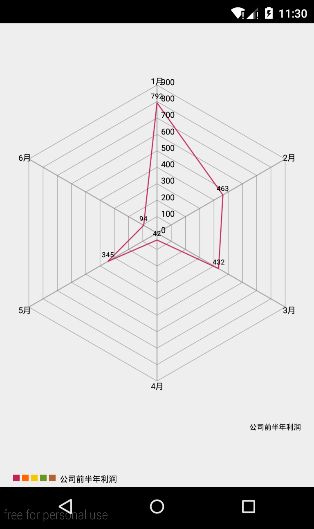
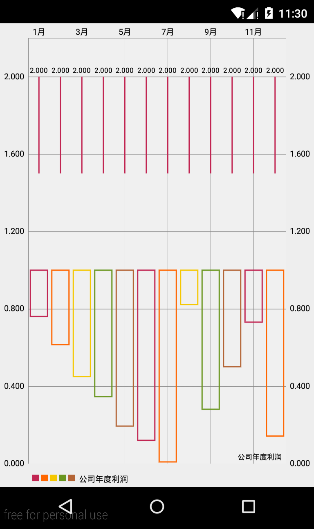
Android的图表世界–如何使用MPAndroidChart
1,将MPAndroidChart添加进Android Project
- 新建AndroidChartDemo
- 从GitHub下载所需的mpandroidchartlibrary-2-0-9.jar(https://github.com/PhilJay/MPAndroidChart/releases)
- 将下载好的jar包添加进工程下的libs文件夹下,并鼠标右键 Add as Libary
2,完成主界面布局
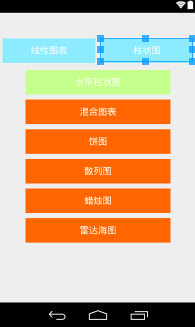
主界面布局是几个比较简单的button,代码如下:
layout->activity_main.xml
"http://schemas.android.com/apk/res/android"
android:orientation="vertical"
android:layout_width="match_parent"
android:layout_height="wrap_content">
"horizontal"
android:layout_marginTop="50dp"
android:layout_marginBottom="4dp"
android:layout_width="match_parent"
android:layout_height="wrap_content">
id="@+id/btn_horizontalchart"
android:text="@string/horizontalchart"
android:textColor="#ffffff"
android:textSize="18sp"
android:background="#C5FF8C"
android:layout_marginTop="10dp"
android:layout_marginLeft="50dp"
android:layout_marginRight="50dp"
android:layout_width="match_parent"
android:layout_height="wrap_content" />
id="@+id/btn_combinedchart"
android:text="@string/combinedchart"
android:textColor="#ffffff"
android:textSize="18sp"
android:background="#FF6600"
android:layout_marginTop="10dp"
android:layout_marginLeft="50dp"
android:layout_marginRight="50dp"
android:layout_width="match_parent"
android:layout_height="wrap_content" />
id="@+id/btn_piechart"
android:text="@string/piechart"
android:textColor="#ffffff"
android:textSize="18sp"
android:background="#FF6600"
android:layout_marginTop="10dp"
android:layout_marginLeft="50dp"
android:layout_marginRight="50dp"
android:layout_width="match_parent"
android:layout_height="wrap_content" />
id="@+id/btn_scatterchart"
android:text="@string/scatterchart"
android:textColor="#ffffff"
android:textSize="18sp"
android:background="#FF6600"
android:layout_marginTop="10dp"
android:layout_marginLeft="50dp"
android:layout_marginRight="50dp"
android:layout_width="match_parent"
android:layout_height="wrap_content" />
id="@+id/btn_candlechart"
android:text="@string/candlechart"
android:textColor="#ffffff"
android:textSize="18sp"
android:background="#FF6600"
android:layout_marginTop="10dp"
android:layout_marginLeft="50dp"
android:layout_marginRight="50dp"
android:layout_width="match_parent"
android:layout_height="wrap_content" />
id="@+id/btn_radarchart"
android:text="@string/radarchart"
android:textColor="#ffffff"
android:textSize="18sp"
android:background="#FF6600"
android:layout_marginTop="10dp"
android:layout_marginLeft="50dp"
android:layout_marginRight="50dp"
android:layout_width="match_parent"
android:layout_height="wrap_content" />
- 1
- 2
- 3
- 4
- 5
- 6
- 7
- 8
- 9
- 10
- 11
- 12
- 13
- 14
- 15
- 16
- 17
- 18
- 19
- 20
- 21
- 22
- 23
- 24
- 25
- 26
- 27
- 28
- 29
- 30
- 31
- 32
- 33
- 34
- 35
- 36
- 37
- 38
- 39
- 40
- 41
- 42
- 43
- 44
- 45
- 46
- 47
- 48
- 49
- 50
- 51
- 52
- 53
- 54
- 55
- 56
- 57
- 58
- 59
- 60
- 61
- 62
- 63
- 64
- 65
- 66
- 67
- 68
- 69
- 70
- 71
- 72
- 73
- 74
- 75
- 76
- 77
- 78
- 79
- 80
- 81
- 82
- 83
- 84
- 85
- 86
- 87
- 88
- 89
- 90
- 91
- 92
- 93
- 94
- 95
- 96
- 97
- 98
- 99
- 100
- 101
3,实现MainActivity.java
将每个Button实例化,通过点击button跳转到相应的Activity,这部分代码比较简单:
MainActivity.Java
    public class MainActivity extends ActionBarActivity implements View.OnClickListener {

    private Button btn_linechart;
    private Button btn_barchart, btn_horizonalbarchart;
    private Button btn_combinedchart;
    private Button btn_piechart;
    private Button btn_scatterchart;
    private Button btn_candlechart;
    private Button btn_radarchart;

    @Override
    protected void onCreate(Bundle savedInstanceState) {
        super.onCreate(savedInstanceState);
        setContentView(R.layout.activity_main);
        btn_linechart = (Button) findViewById(R.id.btn_linechart);
        btn_barchart = (Button) findViewById(R.id.btn_barchart);
        btn_horizonalbarchart = (Button) findViewById(R.id.btn_horizontalchart);

        btn_combinedchart = (Button) findViewById(R.id.btn_combinedchart);

        btn_piechart = (Button) findViewById(R.id.btn_piechart);
        btn_scatterchart = (Button) findViewById(R.id.btn_scatterchart);
        btn_candlechart = (Button) findViewById(R.id.btn_candlechart);
        btn_radarchart = (Button) findViewById(R.id.btn_radarchart);

        btn_linechart.setOnClickListener(this);

        btn_barchart.setOnClickListener(this);
        btn_horizonalbarchart.setOnClickListener(this);
        btn_combinedchart.setOnClickListener(this);
        btn_piechart.setOnClickListener(this);
        btn_scatterchart.setOnClickListener(this);
        btn_candlechart.setOnClickListener(this);
        btn_radarchart.setOnClickListener(this);

    }


    @Override
    public void onClick(View view) {
        Intent intent = null;
        switch (view.getId()) {
            case R.id.btn_linechart:
                intent = new Intent(MainActivity.this, LineChartActivity.class);
                break;
            case R.id.btn_barchart:
                intent = new Intent(MainActivity.this, BarChartActivity.class);
                break;
            case R.id.btn_horizontalchart:
                intent = new Intent(MainActivity.this, HorizontalChart.class);
                break;
            case R.id.btn_combinedchart:
                intent = new Intent(MainActivity.this, CombinedChartActivity.class);
                break;
            case R.id.btn_piechart:
                intent = new Intent(MainActivity.this, PieChartActivity.class);
                break;
            case R.id.btn_scatterchart:
                intent = new Intent(MainActivity.this, ScatterChartActivity.class);
                break;
            case R.id.btn_candlechart:
                intent = new Intent(MainActivity.this, CandleChart.class);
                break;
            case R.id.btn_radarchart:
                intent = new Intent(MainActivity.this, RadarChartActivity.class);
                break;
        }
        startActivity(intent);
    }
    @Override
    public boolean onCreateOptionsMenu(Menu menu) {
        getMenuInflater().inflate(R.menu.menu_main, menu);
        return true;
    }
    @Override
    public boolean onOptionsItemSelected(MenuItem item) {
        return super.onOptionsItemSelected(item);
    }
}- 1
- 2
- 3
- 4
- 5
- 6
- 7
- 8
- 9
- 10
- 11
- 12
- 13
- 14
- 15
- 16
- 17
- 18
- 19
- 20
- 21
- 22
- 23
- 24
- 25
- 26
- 27
- 28
- 29
- 30
- 31
- 32
- 33
- 34
- 35
- 36
- 37
- 38
- 39
- 40
- 41
- 42
- 43
- 44
- 45
- 46
- 47
- 48
- 49
- 50
- 51
- 52
- 53
- 54
- 55
- 56
- 57
- 58
- 59
- 60
- 61
- 62
- 63
- 64
- 65
- 66
- 67
- 68
- 69
- 70
- 71
- 72
- 73
- 74
- 75
- 76
- 77
- 78
- 79
- 1
- 2
- 3
- 4
- 5
- 6
- 7
- 8
- 9
- 10
- 11
- 12
- 13
- 14
- 15
- 16
- 17
- 18
- 19
- 20
- 21
- 22
- 23
- 24
- 25
- 26
- 27
- 28
- 29
- 30
- 31
- 32
- 33
- 34
- 35
- 36
- 37
- 38
- 39
- 40
- 41
- 42
- 43
- 44
- 45
- 46
- 47
- 48
- 49
- 50
- 51
- 52
- 53
- 54
- 55
- 56
- 57
- 58
- 59
- 60
- 61
- 62
- 63
- 64
- 65
- 66
- 67
- 68
- 69
- 70
- 71
- 72
- 73
- 74
- 75
- 76
- 77
- 78
- 79
4,实现对应的各个图表Activity
这才是我们需要真正使用MPAndroid的部分
在开始编写这部分代码之前,我们先来分析一下一个图表需要哪些要素:
- 需要一个数据集DataSet,即我们需要绘制在图中的数据
- 需要设定X、Y坐标对应显示什么
- 通过一个Chart对象将它们显示出来
事实上,任何一个图形库实现绘图功能的逻辑也是这么设计的;
MPAndroidChart的使用:
在这里我们使用倒推摸索的方法来实现绘制一个图表:
首先我们需要知道如何将chart绘制到界面中,有两种方法:
- 在布局文件中
<com.github.mikephil.charting.charts.LineChart
        android:id="@+id/chart"
        android:layout_width="match_parent"
android:layout_height="match_parent" />- 1
- 2
- 3
- 4
- 1
- 2
- 3
- 4
然后在Activity或Fragment中
LineChart chart=(LineChart)findViewById(R.id.chart);
直接在代码中使用 :
LinearChart chart=new LineChart(Context context);
setContentView(chart);- 1
- 2
- 1
- 2
接下来通过下面的方法设置图表需要显示的数据
chart.setData(LineData||BarData之类);//设置显示数据- 1
- 1
那看来又需要一个构造出一个XXData对象
LineData data=new LineData(List<String> xVals,LineDataSet dataSet);//对应横坐标标签和数据集- 1
- 1
看来我们还需要创建dataSet
LineDataSet dataSet=new LineDataSet(List<Entry> yVals,String label);//对应纵坐标条目和对数据集的描述- 1
- 1
现在只需要创建ArrayList即可;
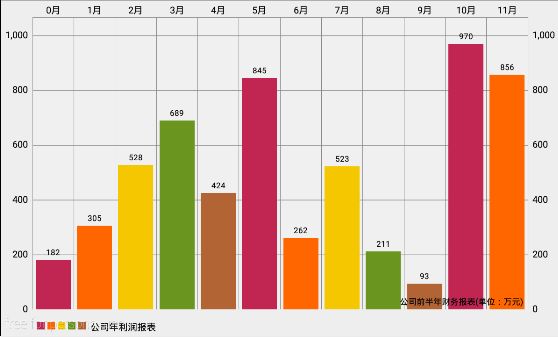
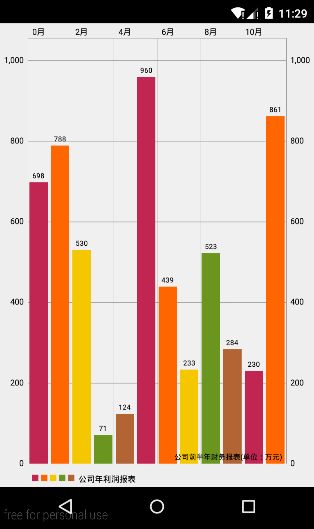
这样的话我们已经把chart的基本过程搞清楚了,我们以一个公司的利润报表为例,以1-12月为横坐标标签,以每个月的利润为yVals,每个月的利润为了方便我是用一个随机数代替,下面看看具体的代码:
    public class BarChartActivity extends Activity {

    private Random random;//用于产生随机数

    private BarChart chart;
    private BarData data;
    private BarDataSet dataSet;

    @Override
    protected void onCreate(Bundle savedInstanceState) {
        super.onCreate(savedInstanceState);
        //设置显示图表
        chart = new BarChart(getApplicationContext());
        setContentView(chart);


        /**图表具体设置*/
        ArrayList entries = new ArrayList<>();//显示条目
        ArrayList xVals = new ArrayList();//横坐标标签
        random=new Random();//随机数
        for(int i=0;i<12;i++){
            float profit= random.nextFloat()*1000;
            //entries.add(BarEntry(float val,int positon);
            entries.add(new BarEntry(profit,i));
            xVals.add((i+1)+"月");
        }
        dataSet = new BarDataSet(entries, "公司年利润报表");
        dataSet.setColors(ColorTemplate.COLORFUL_COLORS);
        data = new BarData(xVals, dataSet);
        chart.setData(data);
        //设置Y方向上动画animateY(int time);
        chart.animateY(3000);
        //图表描述
        chart.setDescription("公司前半年财务报表(单位:万元)");

    }
} - 1
- 2
- 3
- 4
- 5
- 6
- 7
- 8
- 9
- 10
- 11
- 12
- 13
- 14
- 15
- 16
- 17
- 18
- 19
- 20
- 21
- 22
- 23
- 24
- 25
- 26
- 27
- 28
- 29
- 30
- 31
- 32
- 33
- 34
- 35
- 36
- 37
- 1
- 2
- 3
- 4
- 5
- 6
- 7
- 8
- 9
- 10
- 11
- 12
- 13
- 14
- 15
- 16
- 17
- 18
- 19
- 20
- 21
- 22
- 23
- 24
- 25
- 26
- 27
- 28
- 29
- 30
- 31
- 32
- 33
- 34
- 35
- 36
- 37
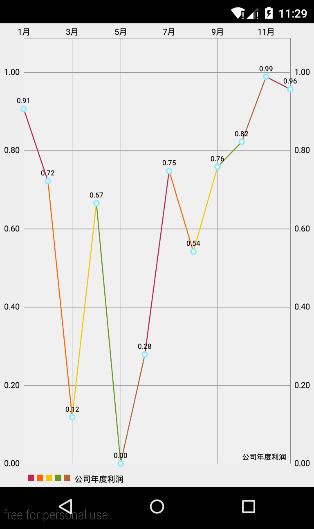
在这里以另一个典型的LineChart为例,大家可以对比与BarChart有什么区别:
LineChartActivity.java
public class LineChartActivity extends Activity {

    private LineChart chart;
    private LineData data;
    private ArrayList xVals;
    private LineDataSet dataSet;
    private ArrayList yVals;
    private Random random;

    @Override
    protected void onCreate(Bundle savedInstanceState) {
        super.onCreate(savedInstanceState);
        chart=new LineChart(this);
        setContentView(chart);
        xVals=new ArrayList<>();
        yVals=new ArrayList<>();
        random=new Random();
        for(int i=0;i<12;i++){
            float profix=random.nextFloat();
            yVals.add(new Entry(profix,i));
            xVals.add((i+1)+"月");
        }
        dataSet=new LineDataSet(yVals,"公司年度利润");
        dataSet.setColors(ColorTemplate.COLORFUL_COLORS);
        data=new LineData(xVals,dataSet);
        chart.setData(data);
        chart.setDescription("公司年度利润");
        chart.animateY(3000);
    }
} - 1
- 2
- 3
- 4
- 5
- 6
- 7
- 8
- 9
- 10
- 11
- 12
- 13
- 14
- 15
- 16
- 17
- 18
- 19
- 20
- 21
- 22
- 23
- 24
- 25
- 26
- 27
- 28
- 29
- 30
- 1
- 2
- 3
- 4
- 5
- 6
- 7
- 8
- 9
- 10
- 11
- 12
- 13
- 14
- 15
- 16
- 17
- 18
- 19
- 20
- 21
- 22
- 23
- 24
- 25
- 26
- 27
- 28
- 29
- 30
可以看到其他Chart的实现方式和BarChat大同小异,只是Data和DataSet子类不同而已,只要掌握了上面所讲的基本步骤,就可以实现其他Chart了,故不再赘述。下面是其他一些常用的方法:
    chart.saveToGallery("mychart.jpg", 85); // 保存图表,85 is the quality of the image
    LimitLine line = new LimitLine(10f);
    data.addLimitLine(line);//添加图表的限制线
dataset.setColors(ColorTemplate.COLORFUL_COLORS);//让数据集显示不同的颜色- 1
- 2
- 3
- 4
- 1
- 2
- 3
- 4
总结:
这里只是抛砖引玉,讲解了MPAndroidChart的基本用法,大家可以举一反三,研究下源码,根据自己的需求实现更加复杂和多变的Chart,英文好的同学也可以去研究下文档(https://github.com/PhilJay/MPAndroidChart/wiki)
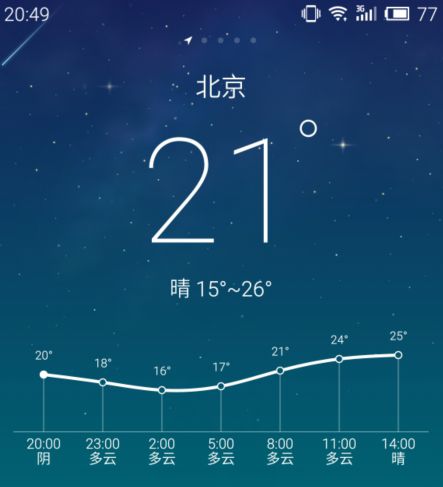
作为检验,你可以试着用今天所学的实现下面天气变化的效果:
