pyecharts(9)-动态可视化-树形图-思维导图
树状图基本(1 of 3)
基本信息
class TreeItem(
# 树节点的名称,用来标识每一个节点。
name: Optional[str] = None,
# 节点的值,在 tooltip 中显示。
value: Optional[Numeric] = None,
# 该节点的样式
label_opts: Optional[LabelOpts] = None,
# 子节点,嵌套定义。
children: Optional[Sequence] = None,
)
简化版(便于理解)
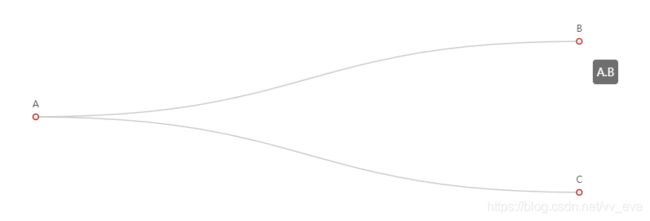
最简单的的树形图:
"children": [{"name":"B"},{"name":"C"}], "name":"A",

from pyecharts import options as opts
from pyecharts.charts import Tree
data = [
    {

        "children": [
            {
     "name": "B"},
            {

                "children": [{
     "children": [{
     "name": "I"}], "name": "E"}, {
     "name": "F"}],
                "name": "C",
            },
            {

                "children": [
                    {
     "children": [{
     "name": "J"}, {
     "name": "K"}], "name": "G"},
                    {
     "name": "H"},
                ],
                "name": "D",
            },
        ],
        "name": "A",
    }
]
c = (
    Tree()
    .add("", data)
    .set_global_opts(title_opts=opts.TitleOpts(title="Tree-基本示例"))
    .render("tree_base.html")
)
树状图进阶-树形图走向(2 of 3)
用到的文件:https://echarts.apache.org/examples/data/asset/data/flare.json
树形图走向
orient="BT"
只有在 layout = ‘orthogonal’ 的时候,该配置项才生效(这个是默认正交布局)。
从下到上。取值分别为 LR (从左到右),RL(从右到左), TB(垂直方向的从上到下), BT(垂直方向的从下到上)
之前的配置项值 ‘horizontal’ 等同于 ‘LR’, ‘vertical’ 等同于 ‘TB’。
折叠间隔
collapse_interval=1 折叠节点间隔,当节点过多时可以解决节点显示过杂间隔
import json
from pyecharts import options as opts
from pyecharts.charts import Tree

with open("flare.json", "r", encoding="utf-8") as f:
    j = json.load(f)
c = (
    Tree()
    .add(
        "",
        [j],
        collapse_interval=1, #折叠节点间隔
        orient="BT", # 从下到上。取值分别为 'LR' , 'RL', 'TB', 'BT'。注意,
        label_opts=opts.LabelOpts(
            position="top",
            horizontal_align="right",
            vertical_align="middle",
            rotate=-90, #文字方向
        ),
    )
    .set_global_opts(title_opts=opts.TitleOpts(title="Tree-下上方向"))
    .render("tree_bottom_top.html")
)
树形图(3 of 3)
设置layout布局
layout="radial"
import pyecharts.options as opts
from pyecharts.charts import Tree
with open("flare.json", "r", encoding="utf-8") as f:
    data = json.load(f)
(
    Tree(init_opts=opts.InitOpts(width="1400px", height="800px"))
    .add(
        series_name="",
        data=[data],
        collapse_interval=3,
        pos_top="18%",
        pos_bottom="14%",
        layout="radial",
        symbol="emptyCircle",
        symbol_size=7,
    )
    .set_global_opts(
        tooltip_opts=opts.TooltipOpts(trigger="item", trigger_on="mousemove")
    )
    .render("radial_tree.html")
)
还有矩阵树图,但我觉得有点太偏门了,所以就没有整理。
上一节:饼图
https://blog.csdn.net/vv_eve/article/details/107991704